Author(s)
Tyler Sutterley
Part 1: Mission and Instrument Overview
ICESat-2 Science Objectives
- Quantify polar ice sheet contributions to current and recent sea level change and the linkages to climate conditions
- Quantify regional signatures of ice sheet changes
- Assess mechanisms driving recent changes
- Improve predictive ice sheet models
- Estimate sea ice thickness to examine ice-ocean-atmosphere exchanges of energy, mass and moisture
- Measure vegetation canopy height as a basis for estimating large-scale biomass and biomass change
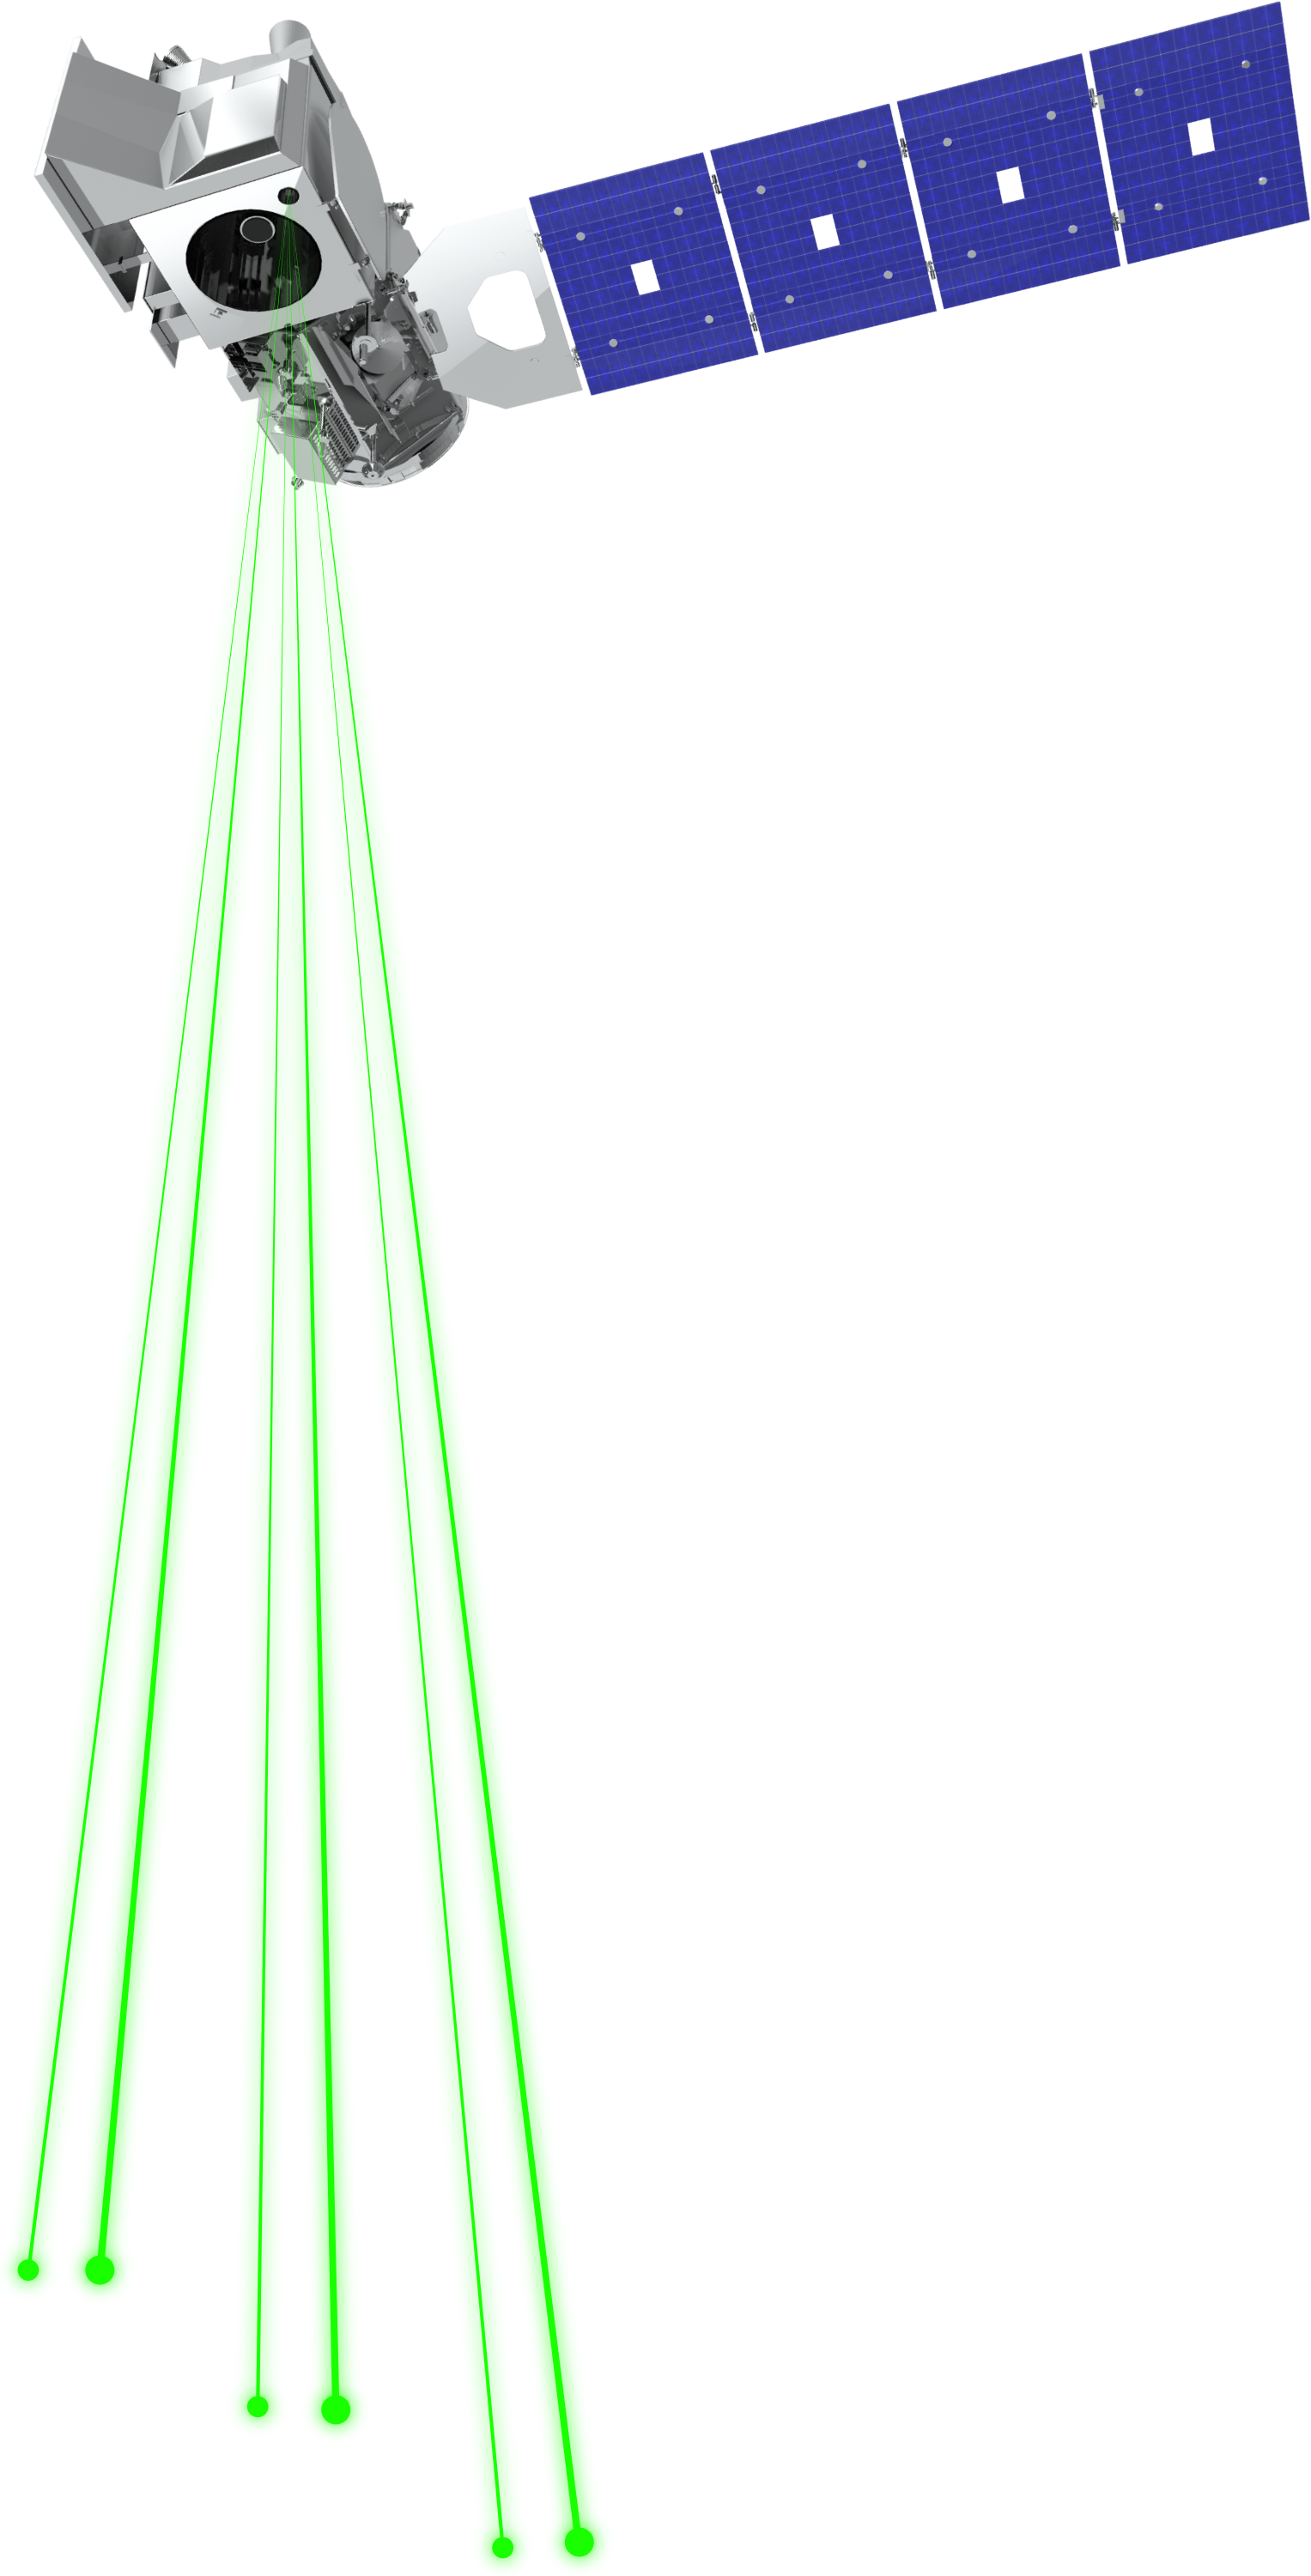
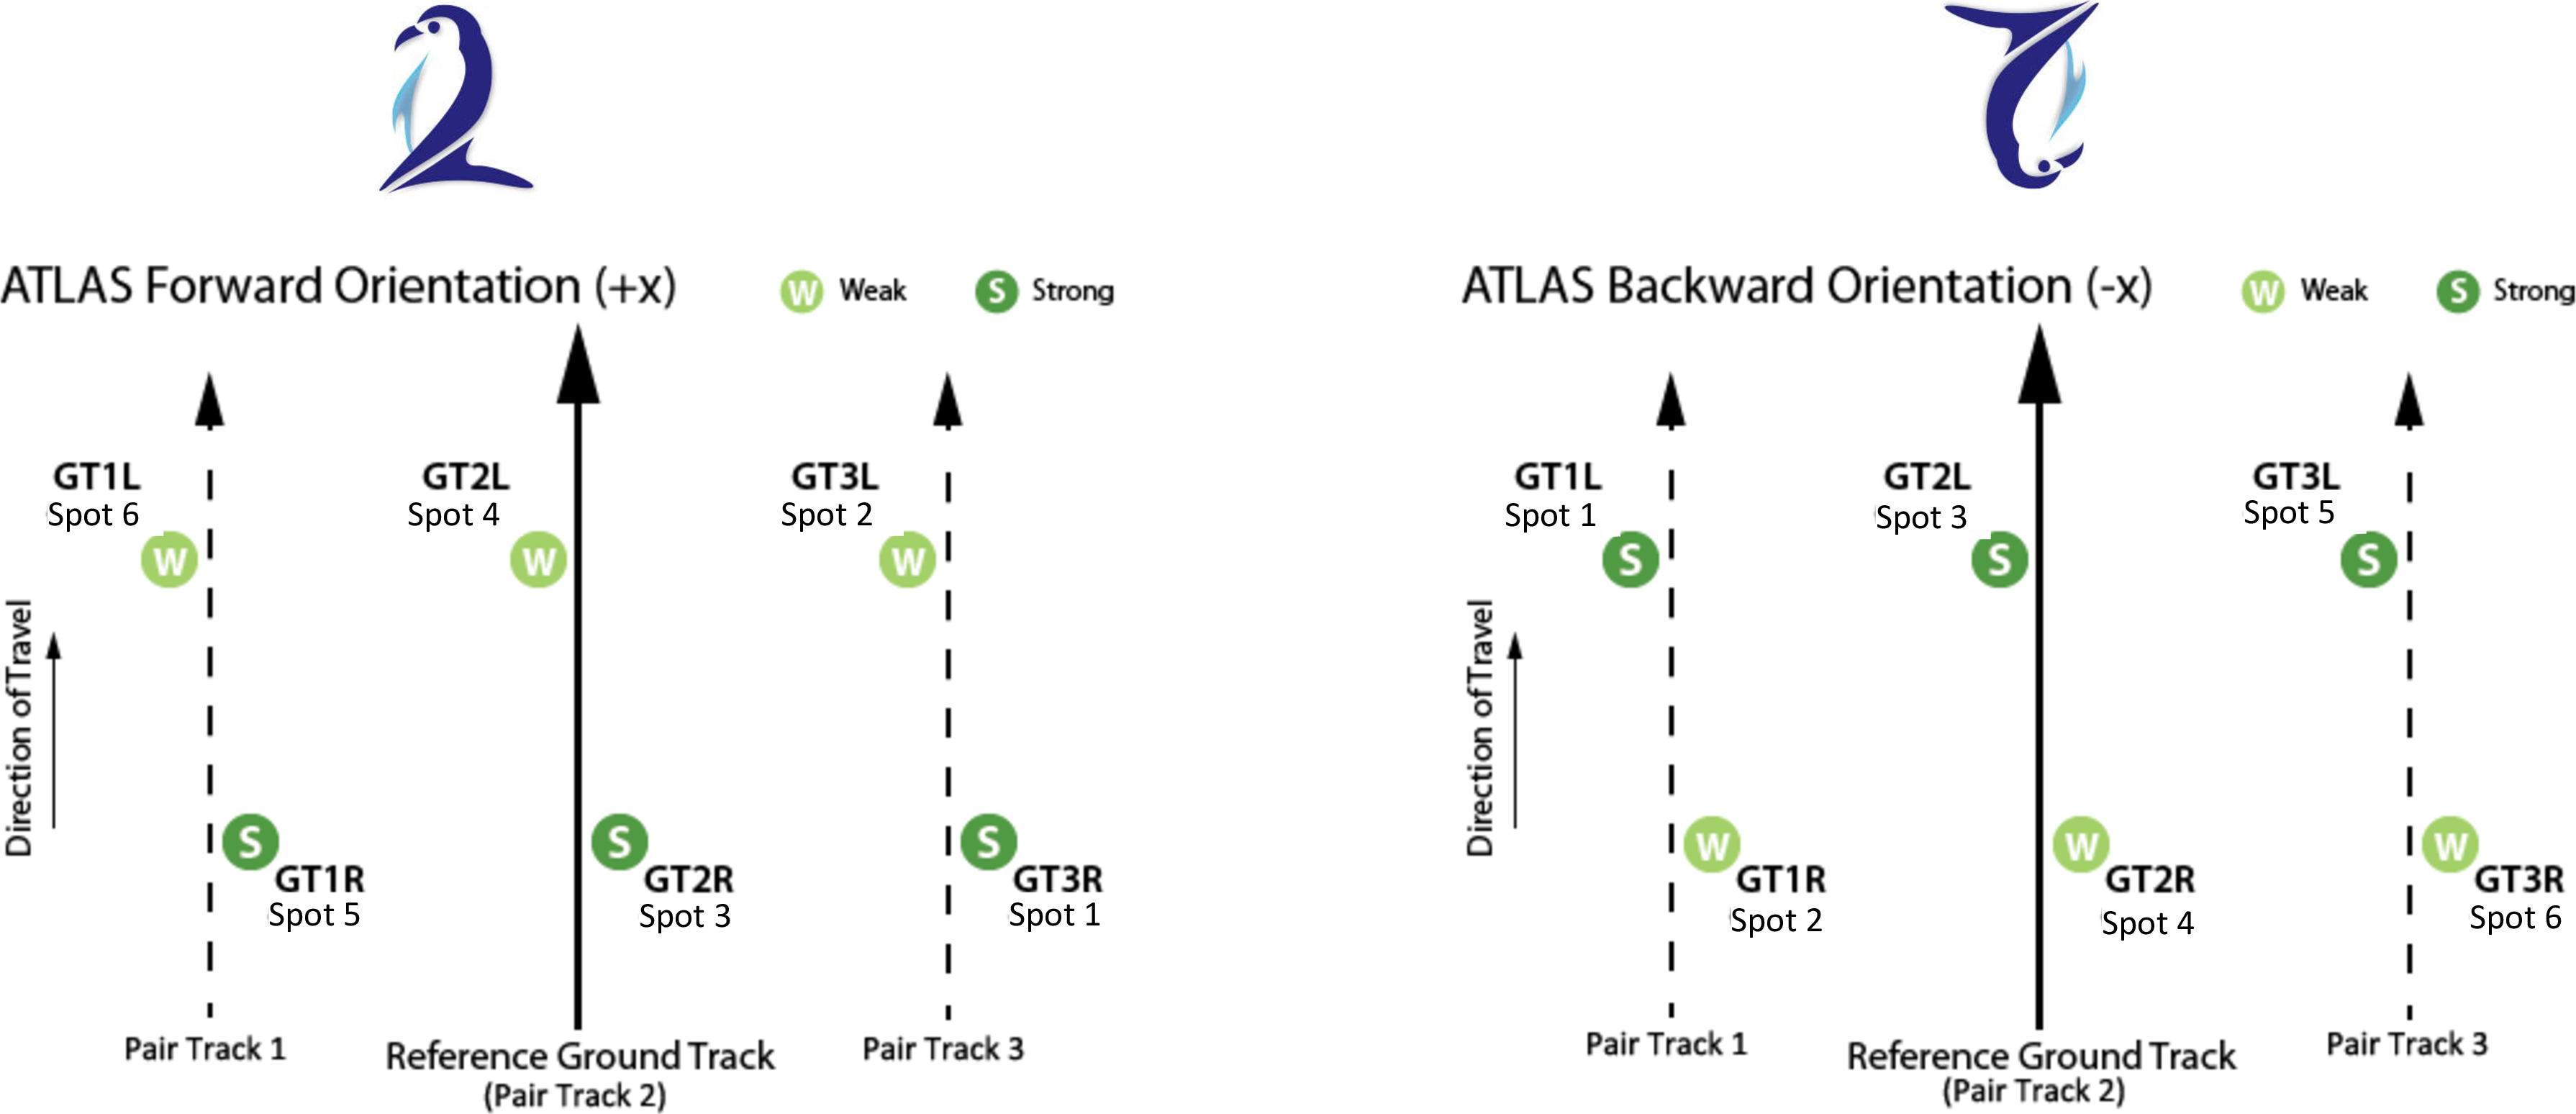
Advanced Topographic Laser Altimeter System (ATLAS)
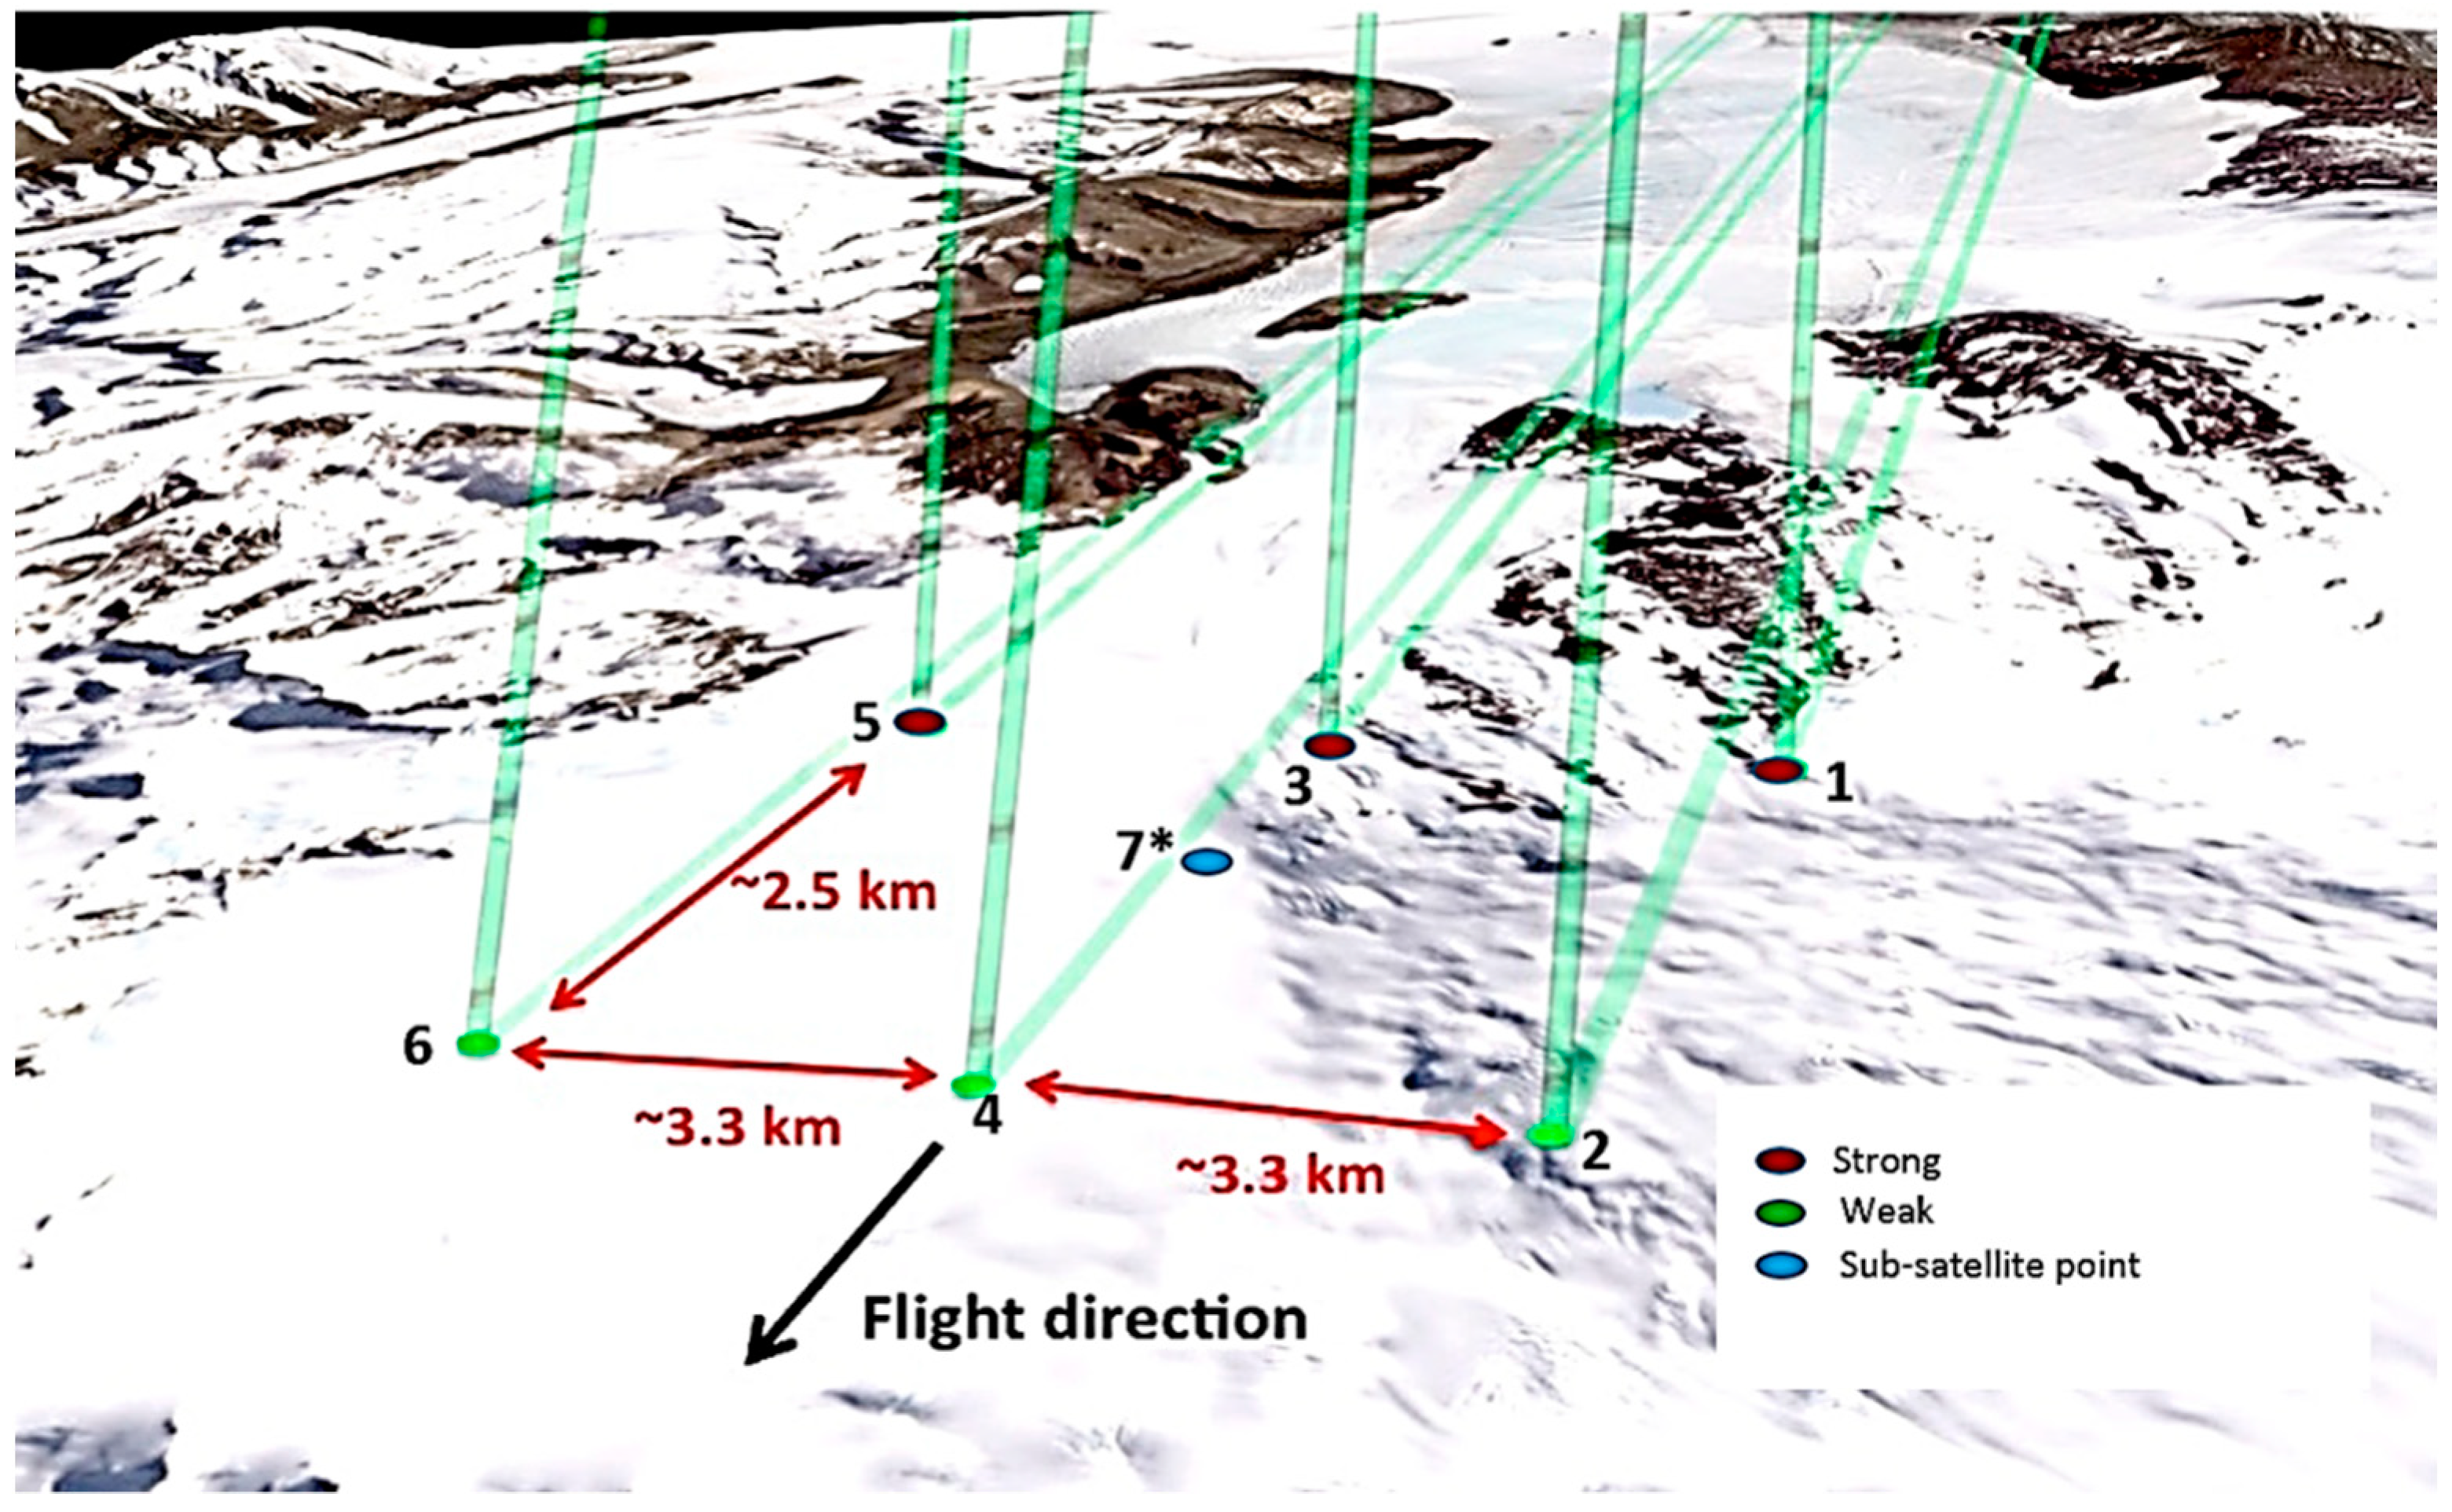
Figure 1:ICESat-2 beam configuration (Neuenschwander, 2019)
- Single 10kHz 532nm laser micro-pulse → split into 6 beams
- Detectors sensitive to green light returns at the single photon level
- On-the-ground 3 km spacing between pairs to increase spatial coverage
- On-the-ground 90 m pair spacing for slope determination
- Different beam energies to provide dynamic range for varying surface reflectances
- High-energy beams (4×) for better performance over low-reflectivity targets
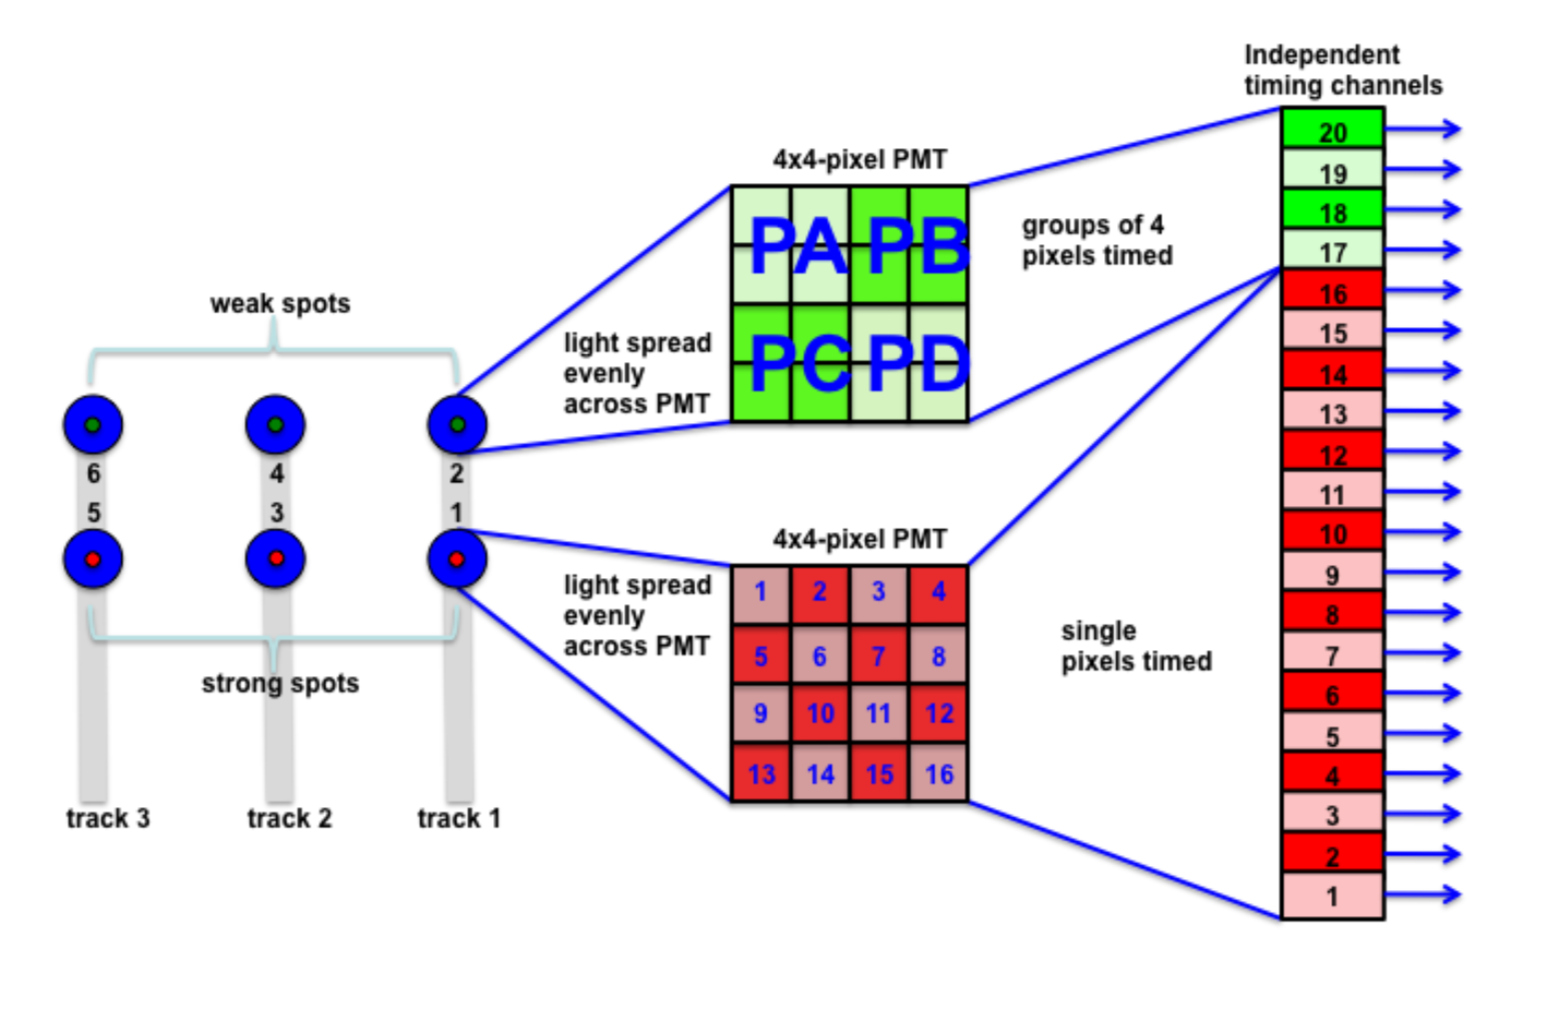
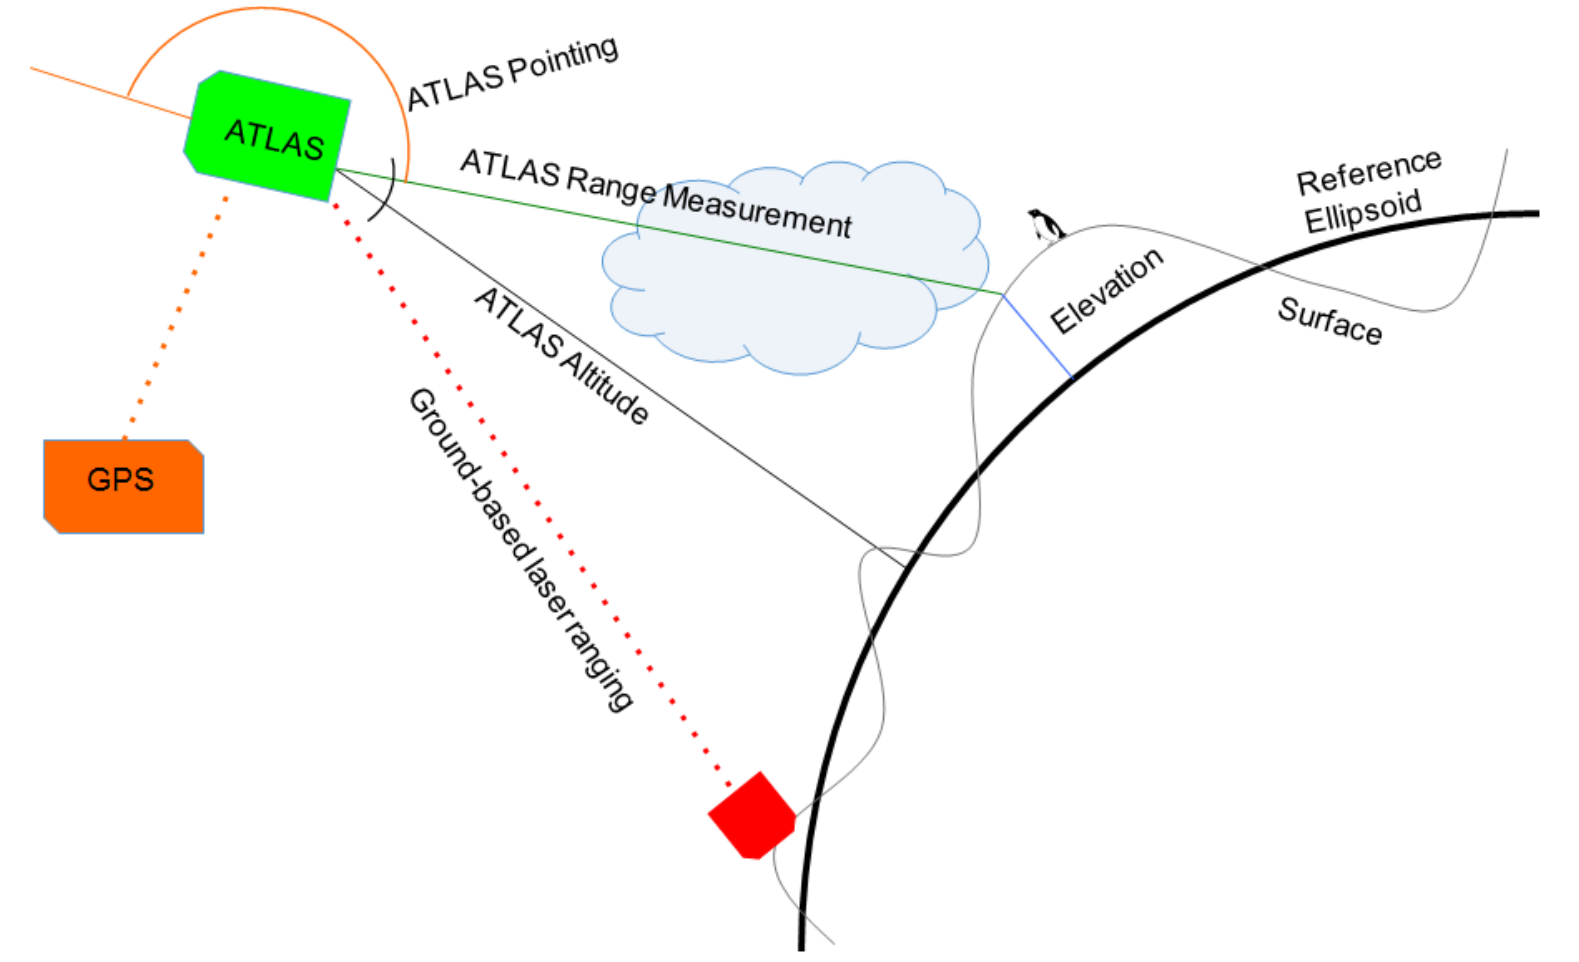
ICESat-2 Photon Geolocation
Photon time of flight
- Measuring the two-way return time of transmitted photons
Position of observatory in space
- Precision Orbit Determination (POD) – NASA GSFC
- Based on Ruag GPS receivers
- Verified with Satellite Laser Ranging (SLR)
- Orbit known to < 2 cm radial
Pointing vectors for ATLAS laser beams
- Precision Pointing Determination (PPD) – UT Austin Applied Research Lab
- Based on Sodern Star Trackers and Laser Reference System (LRS)
- Verified with cal/val data comparisons with photon returns
ICESat-2 Orbits
- 500 km altitude
- 88° S to 88° N
- 15 revolutions/day
- 1387 repeat ground tracks
- 91-day revisit time
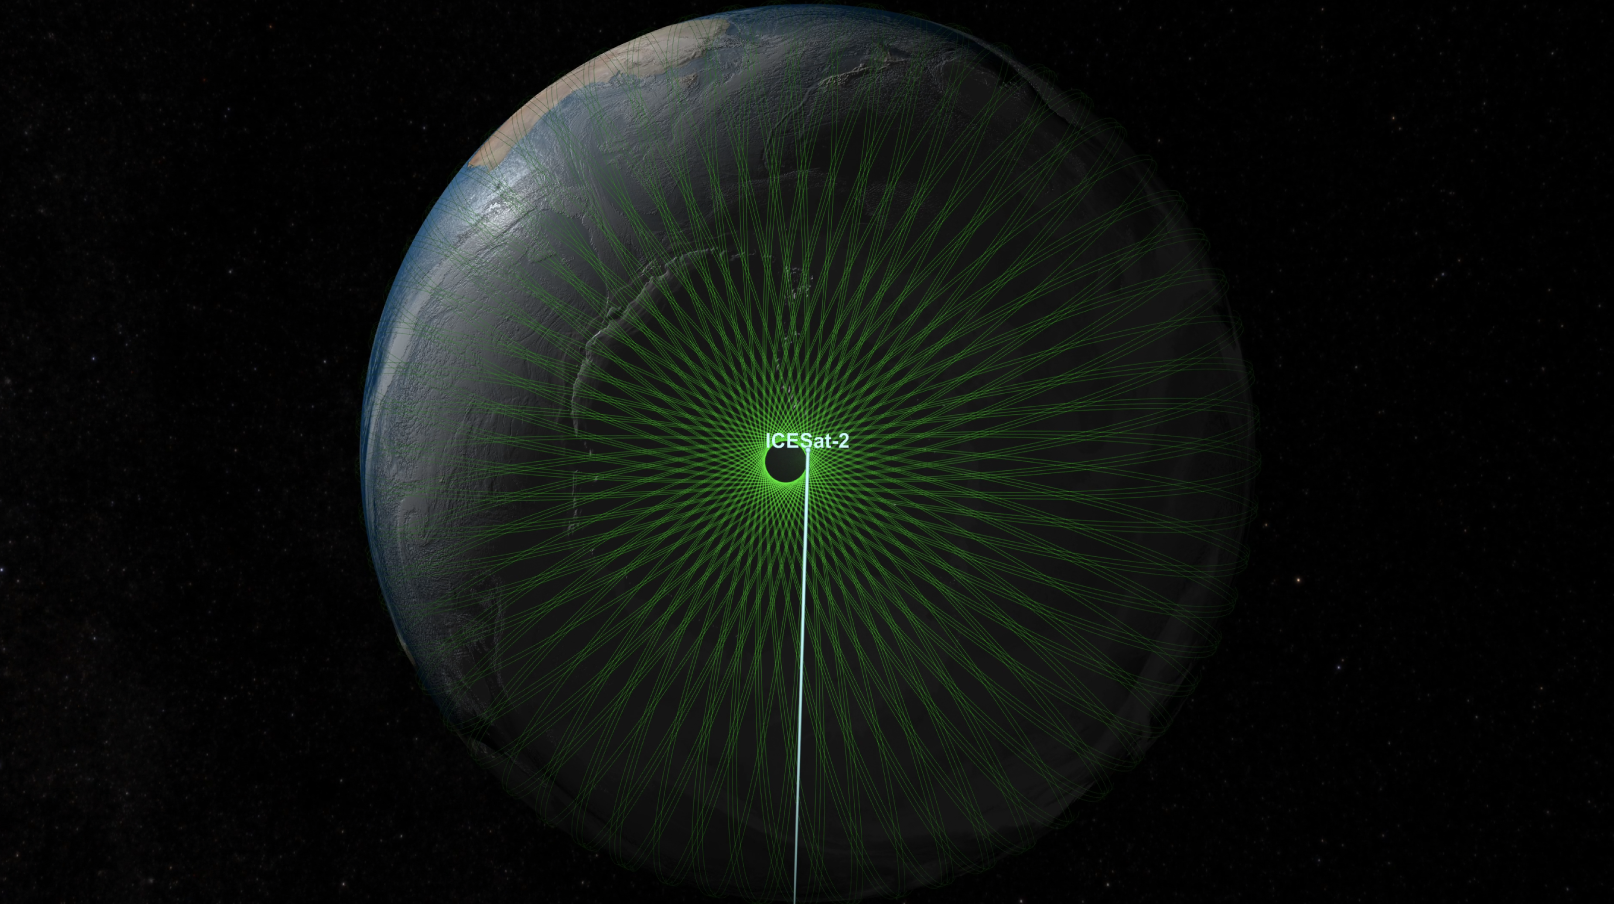
Figure 6:ICESat-2 Orbits (NASA Science Visualization Studio)
ICESat-2 Along-Track Sampling
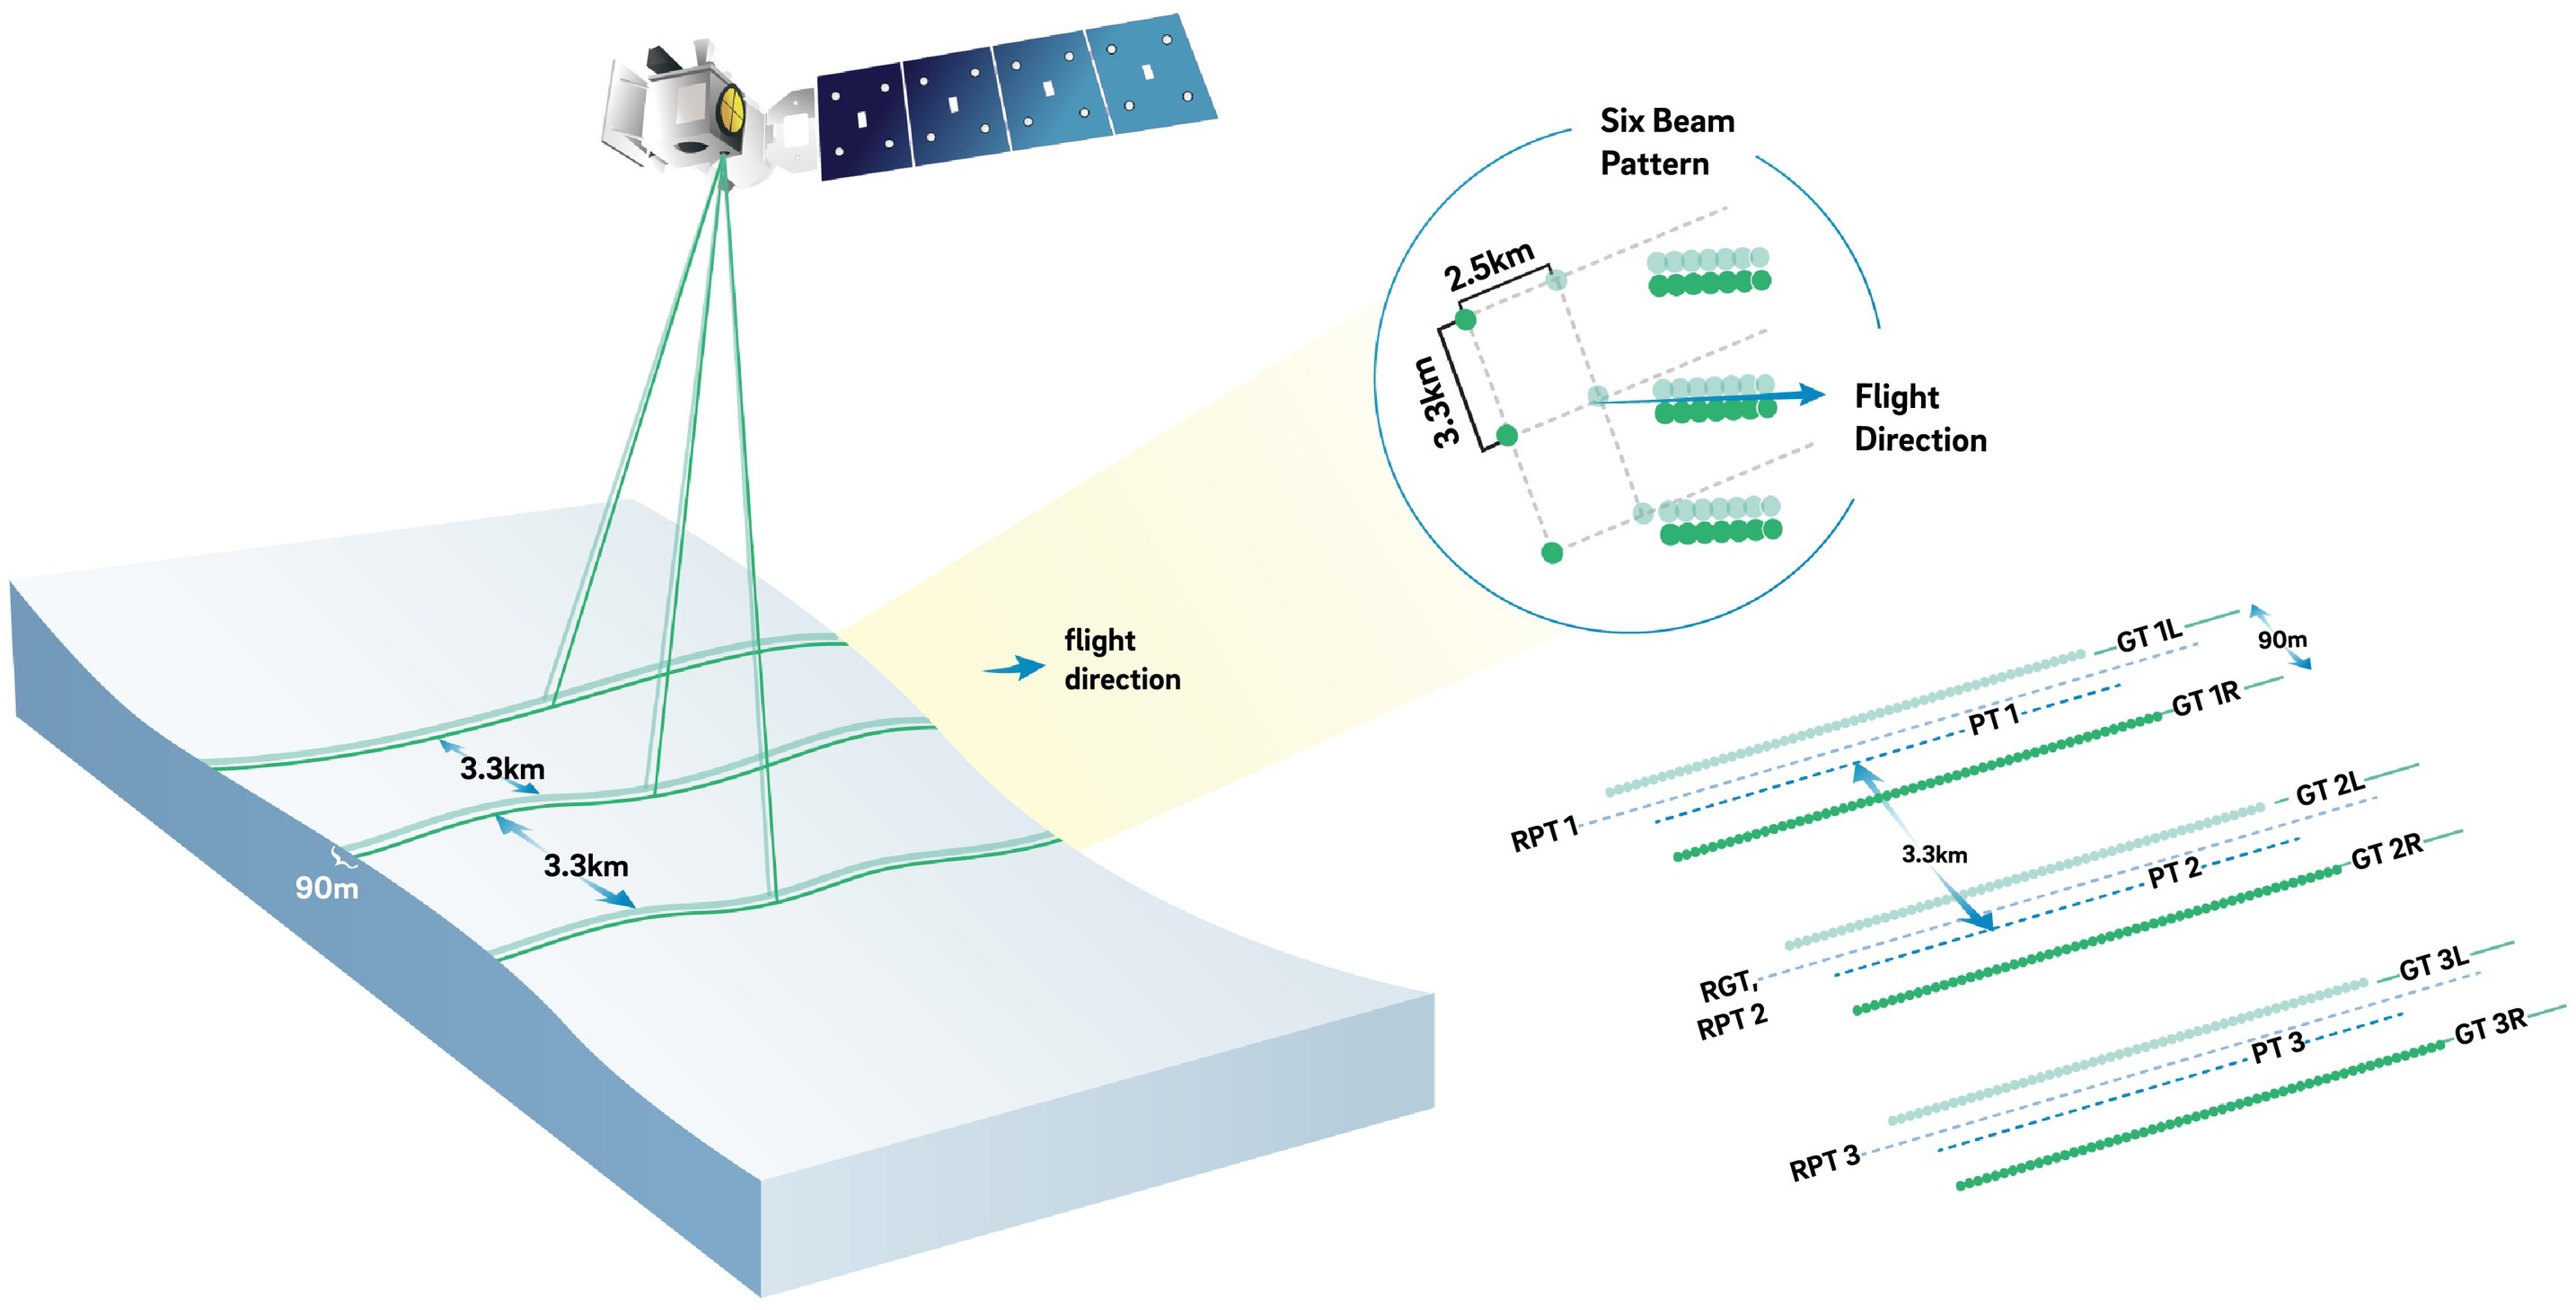
Figure 7:ICESat-2 beam configuration (Smith et al., 2019)
ICESat-2 Local Coordinate System
- Along-track coordinates,
x_atc, are measured parallel to each RGT and are in reference to the equator - Across-track coordinates,
y_atc, are measured perpendicular to and in reference to the RGT - Averaging Schemes:
- Measurements can be averaged over a set along-track distance
- Measurements can be averaged over a set number of photons and have a variable along-track length
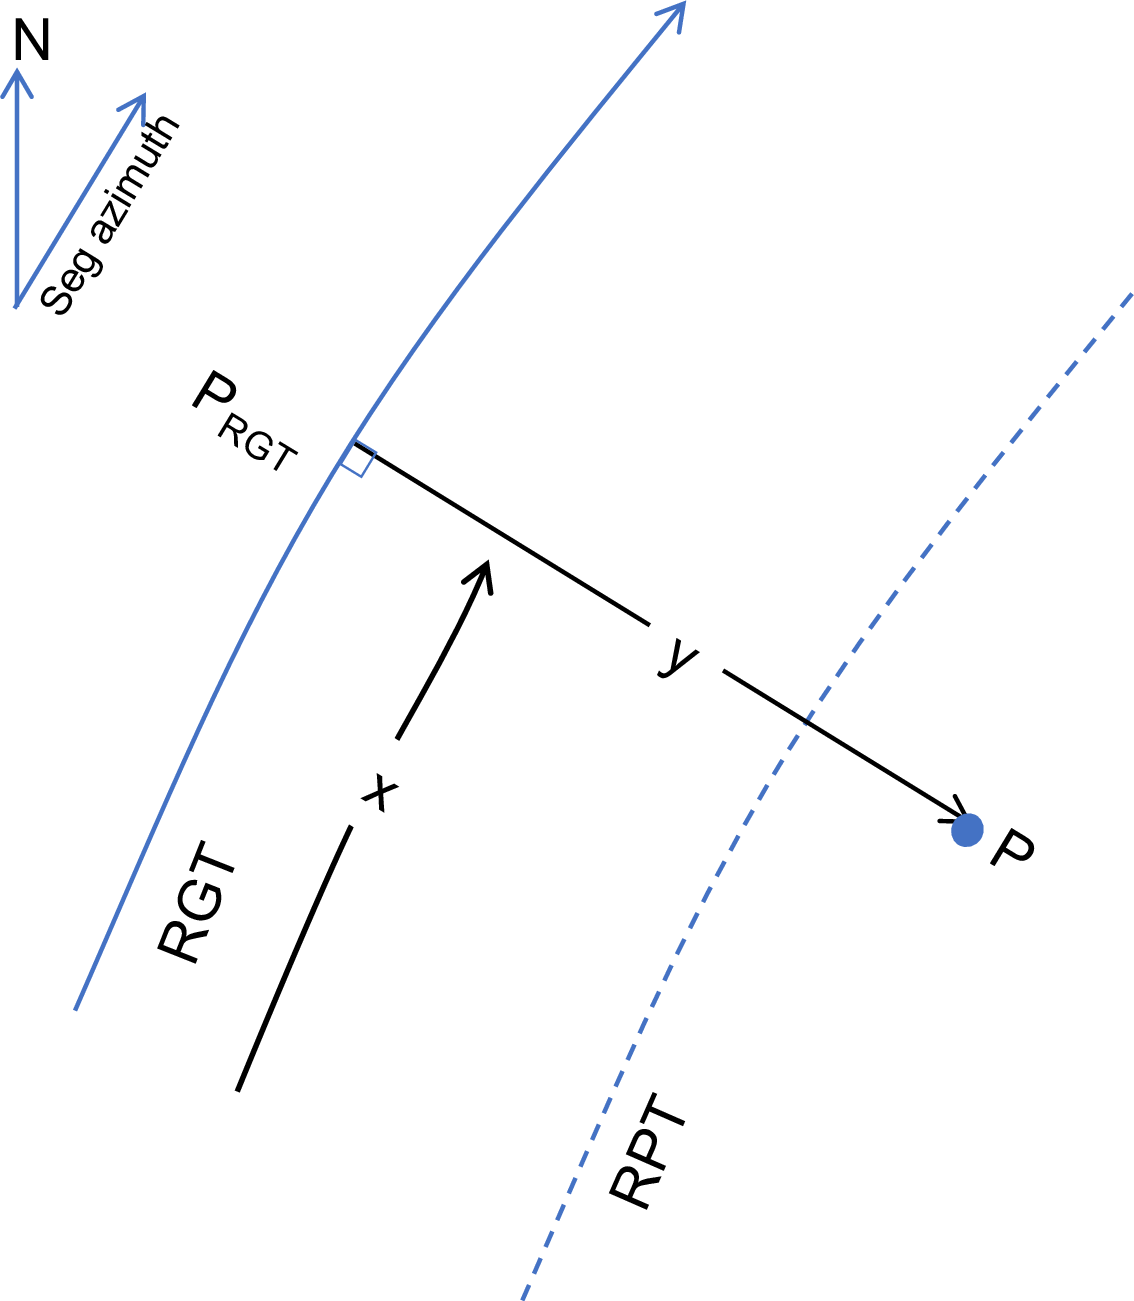
Figure 9:ICESat-2 coordinate system (ATL06 ATBD)
Part 2: Data Products
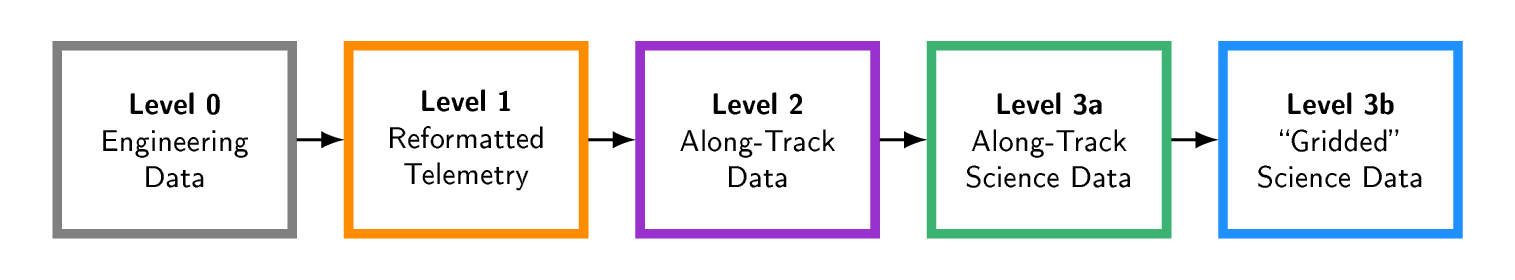
ICESat-2 Data Production
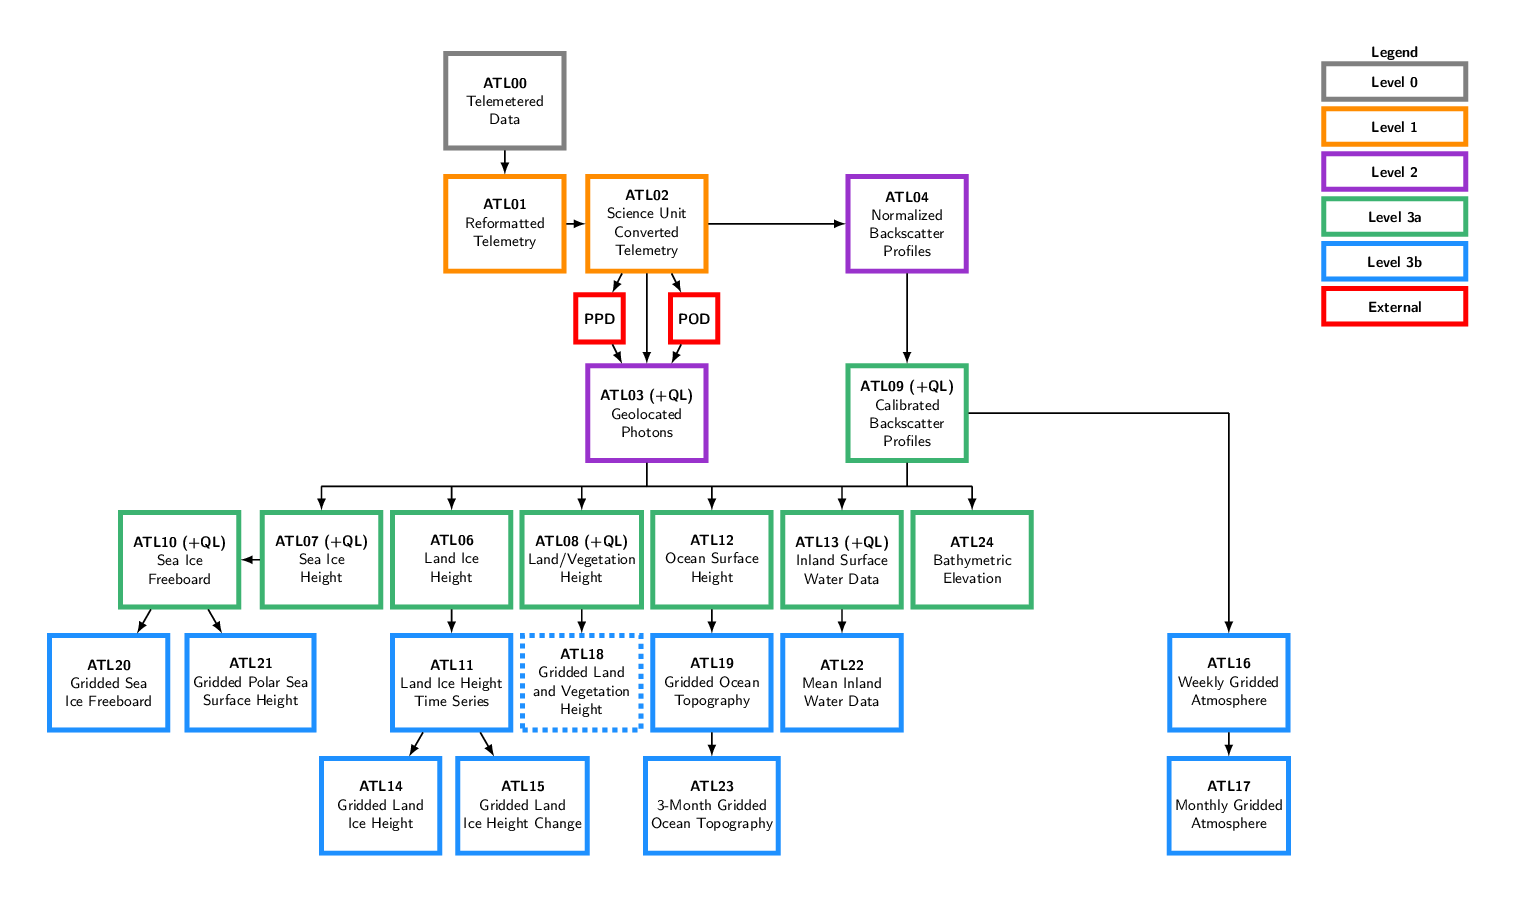
ICESat-2 Product Chart
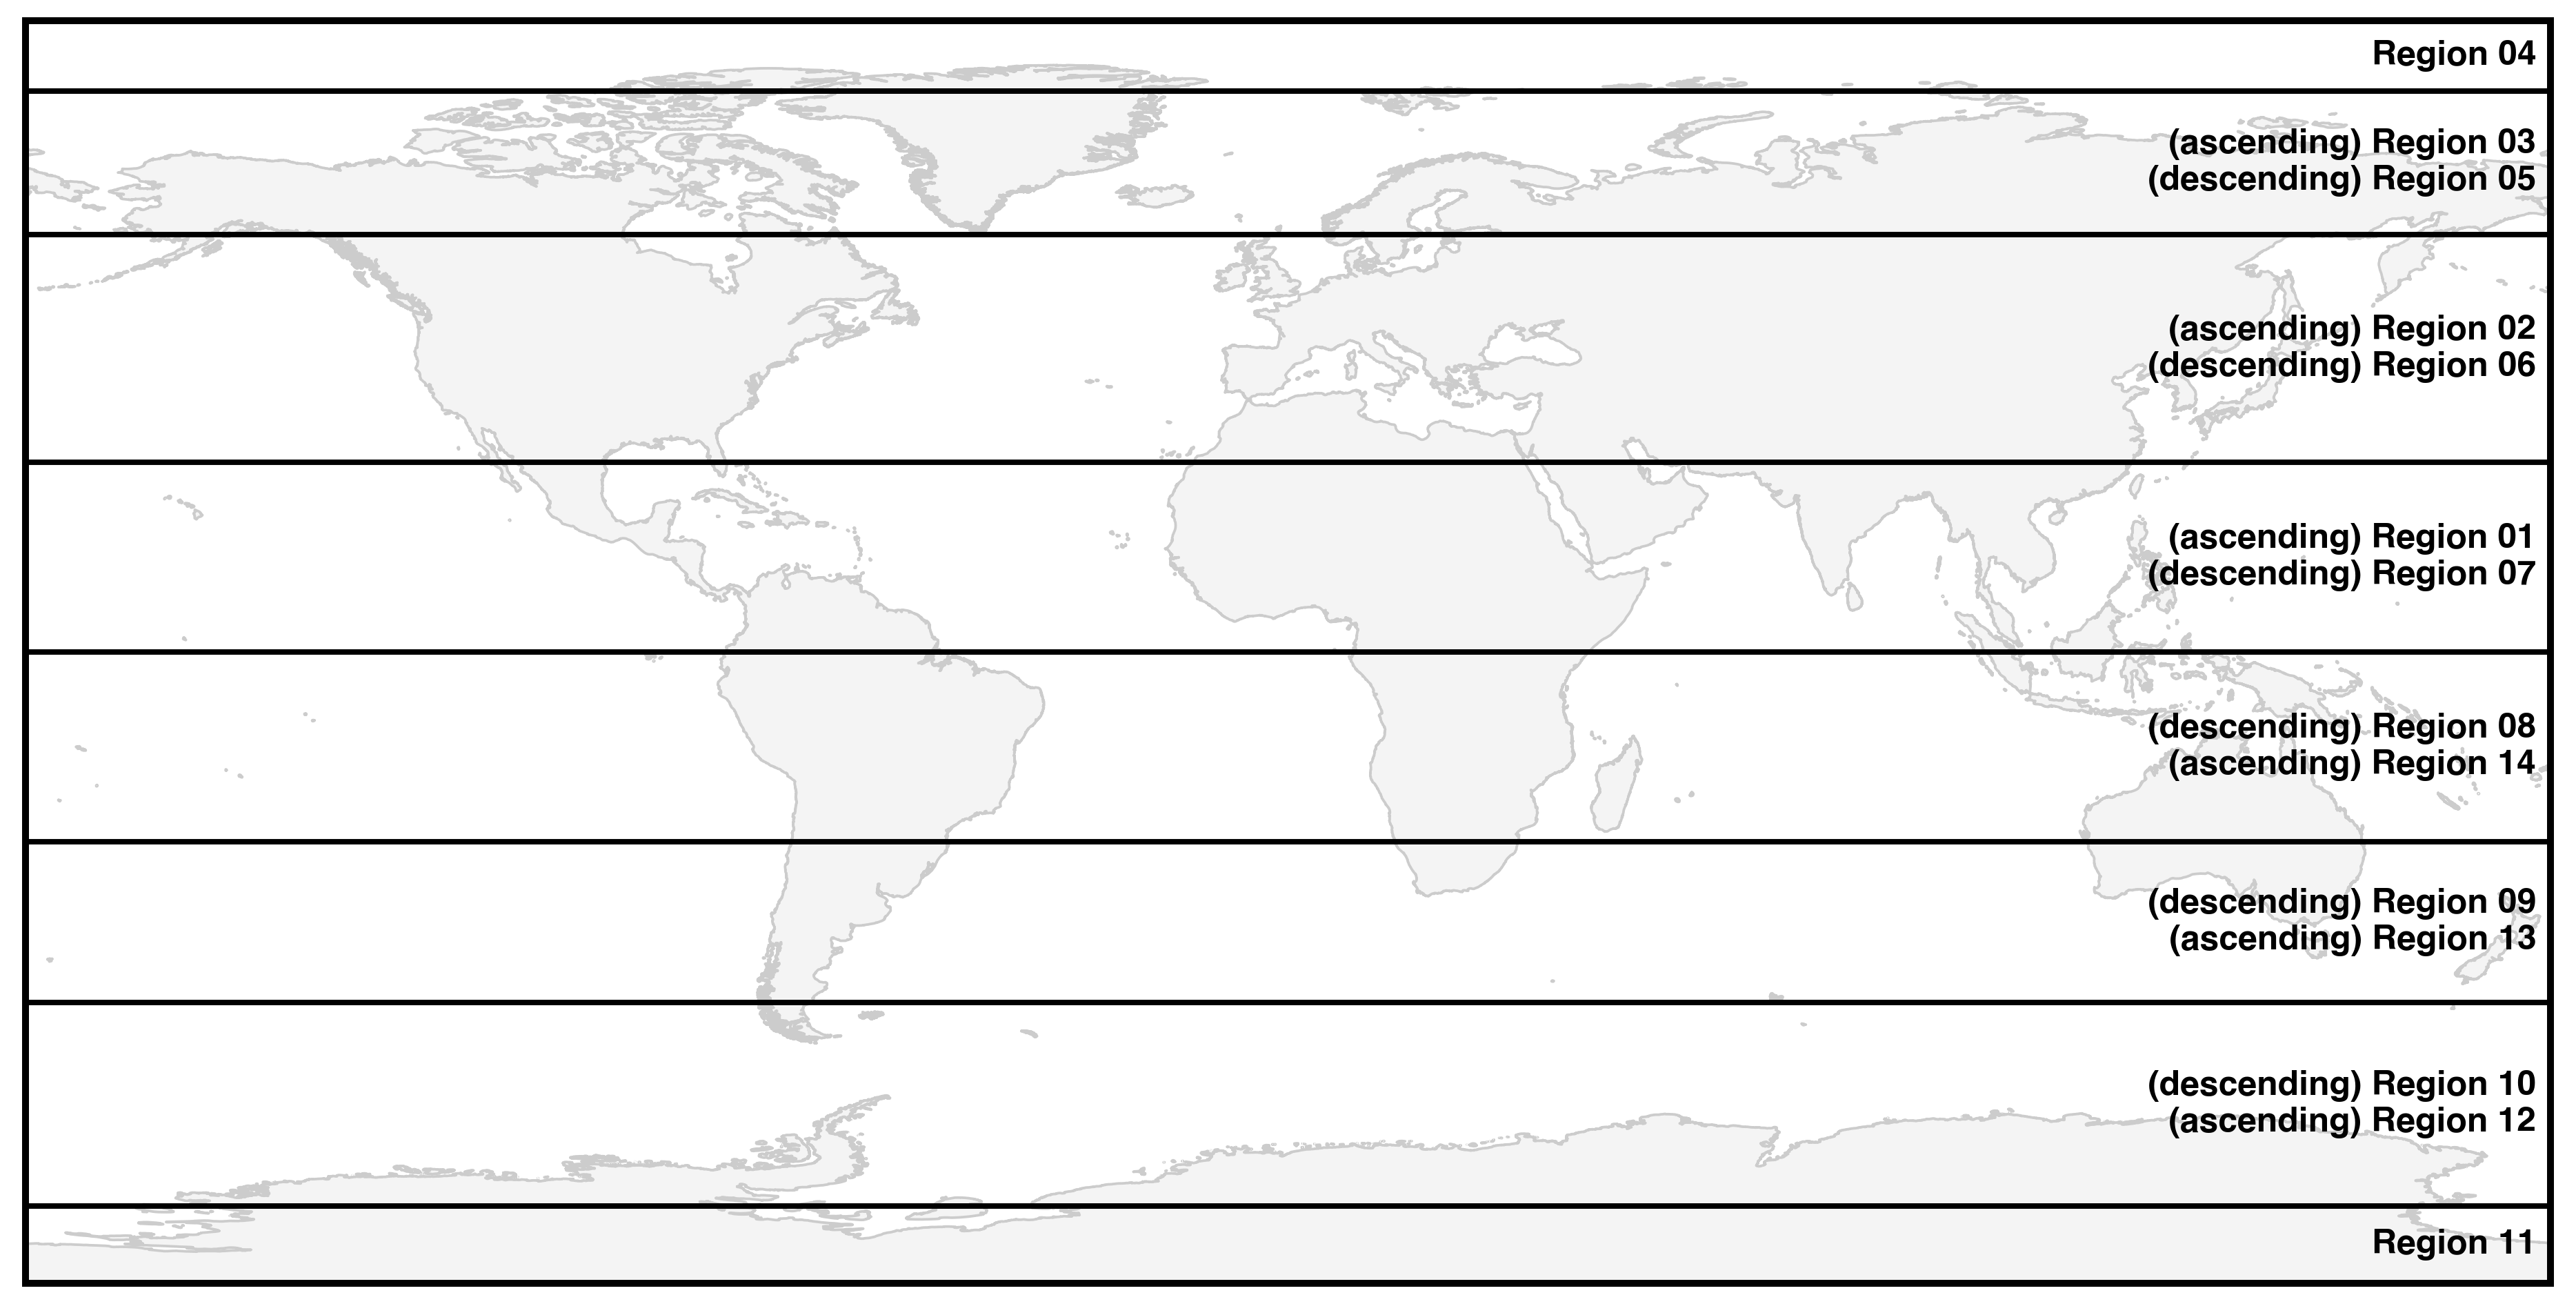
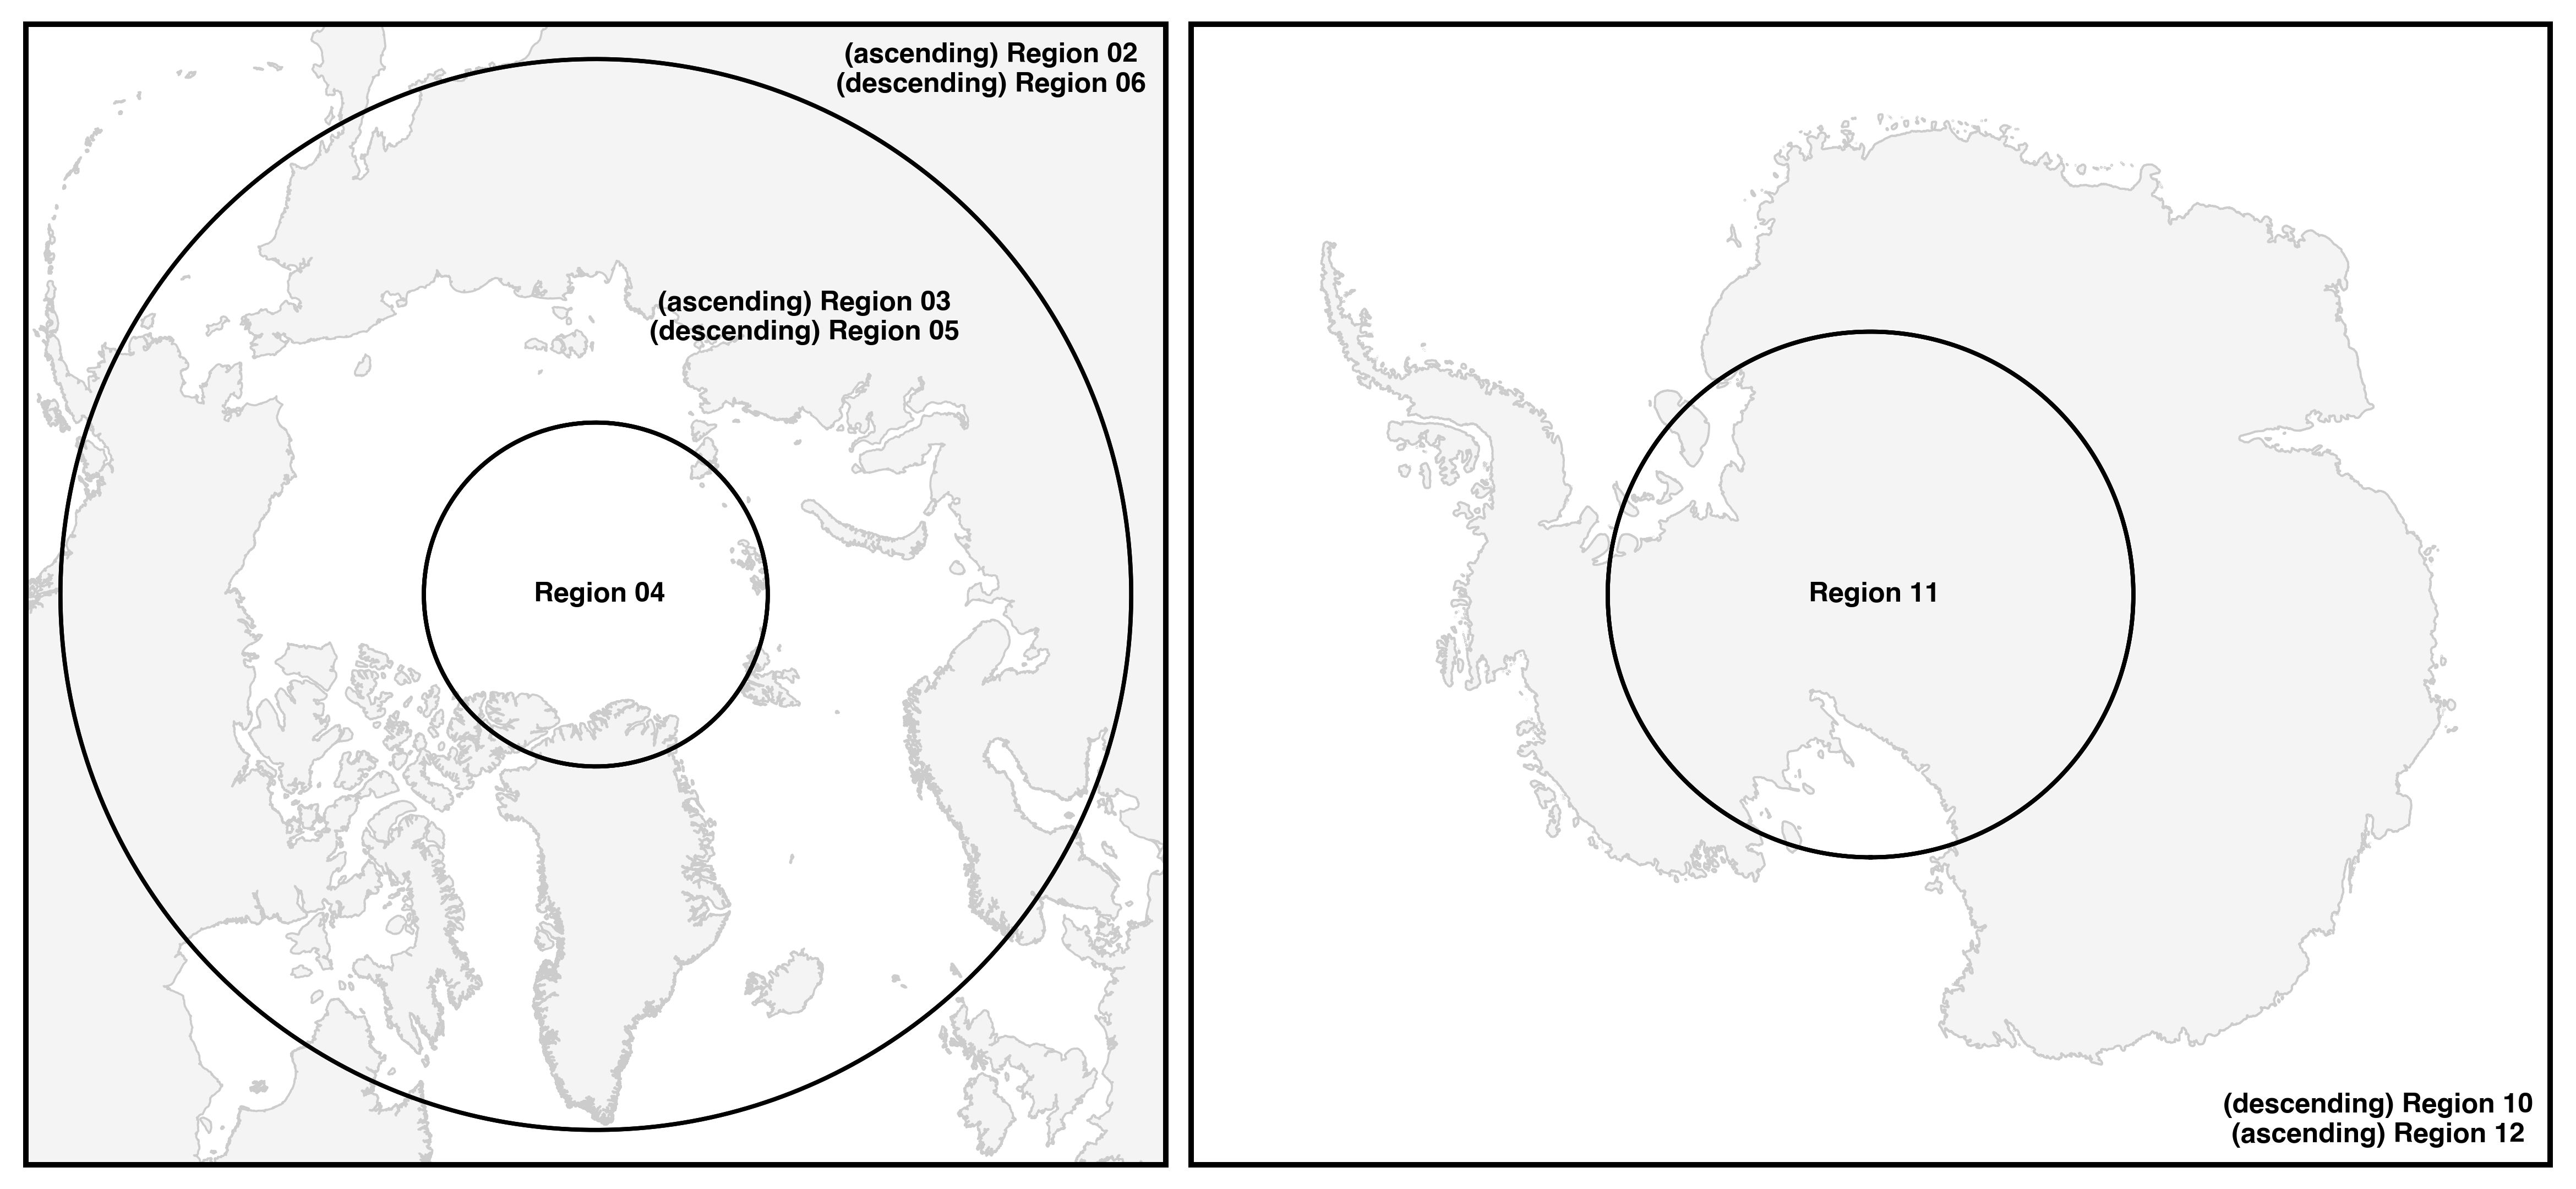
Granule Regions
Each orbit of ICESat-2 data is broken up into 14 granules in order to limit the overall file sizes and to reduce the number of files that need to be processed to create the higher-level science products
File Naming Conventions
ATL[xx]_[yyyymmdd][hhmmss]_[tttt][cc][nn]_[rrr]_[vv].h5xx: ATLAS product numberyyyymmdd: year, month and day of data acquisitionhhmmss: start time, hour, minute, and second of data acquisition (UTC)tttt: Reference Ground Track (RGT, ranges from 1–1387)cc: Orbital Cycle (91-day period)nn: Granule number (ranges from 1–14, always 01 for atmosphere products)rrr: Data release numbervv: Data version number
File Naming Conventions: Sea Ice
ATL[xx]-[hh]_[yyyymmdd][hhmmss]_[tttt][cc][nn]_[rrr]_[vv].h5xx: ATLAS product numberhh: Sea ice hemisphere flag (01=north, 02=south)yyyymmdd: year, month and day of data acquisitionhhmmss: start time, hour, minute, and second of data acquisition (UTC)tttt: Reference Ground Track (RGT, ranges from 1–1387)cc: Orbital Cycle (91-day period)nn: Granule number (always 01 for sea ice products)rrr: Data release numbervv: Data version number
ATL03: Global Geolocated Photon Data
Contains:
- Geolocation, time and elevation for all photons telemetered from ATLAS
- Photon classifications for each surface type
- Geophysical and atmospheric corrections
- Instrumental parameters
Advantages:
- Every photon is there, and every parameter
- Can derive information for all surface types
Disadvantages:
- Large and complex product
- Might require applying instrumental corrections
Use if you want to:
- Look at surfaces at a scale unresolved in higher-level products
- Look at processes the higher-level products were not designed to observe
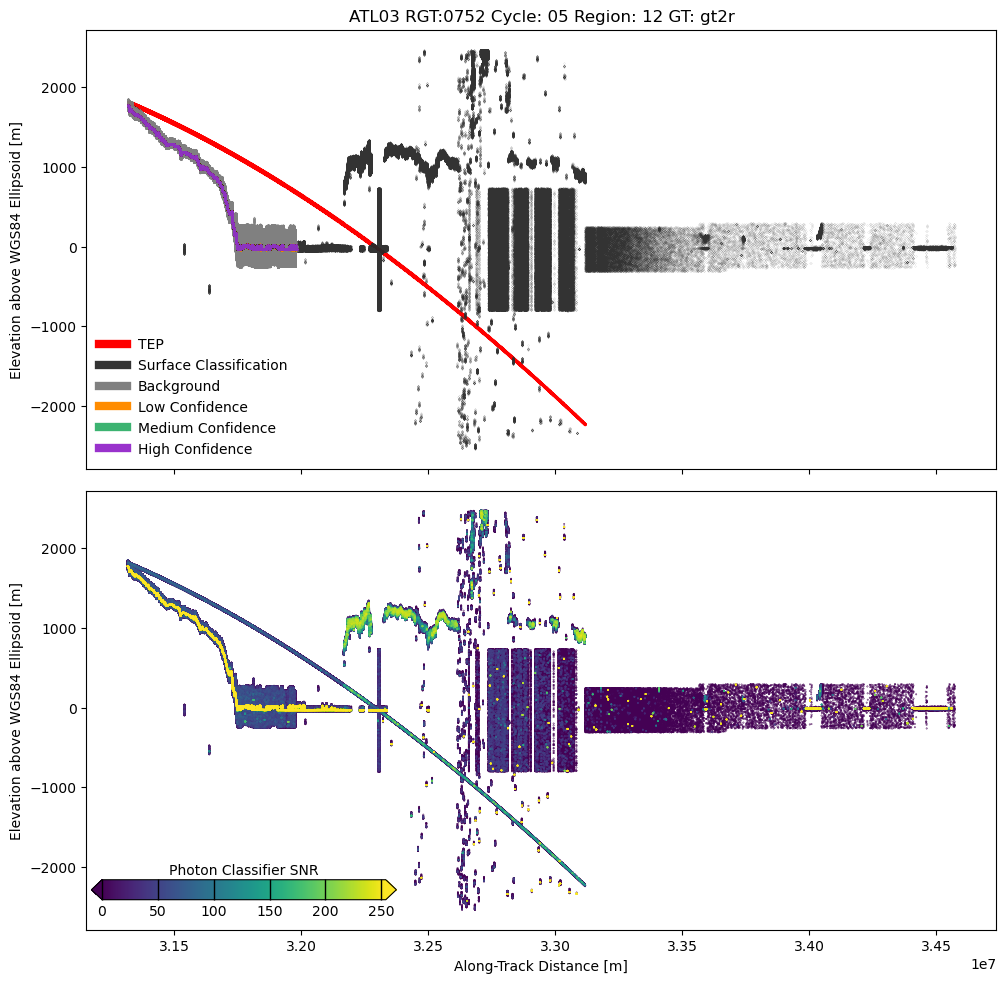
Figure 10:ATL03 photon data and YAPC classification
ATL04 and ATL09: Atmospheric Backscatter Profiles
Contains:
- Atmospheric layer heights and optical properties
Advantages:
- Much larger height window provided from the atmospheric data channel
Disadvantages:
- Relatively large file sizes
Use if you want to:
- Want to investigate cloud or suspended particle optical depths
- Visualize cloud returns or Antarctic blowing snow
- Want to try to understand atmospheric effects on photon ground returns
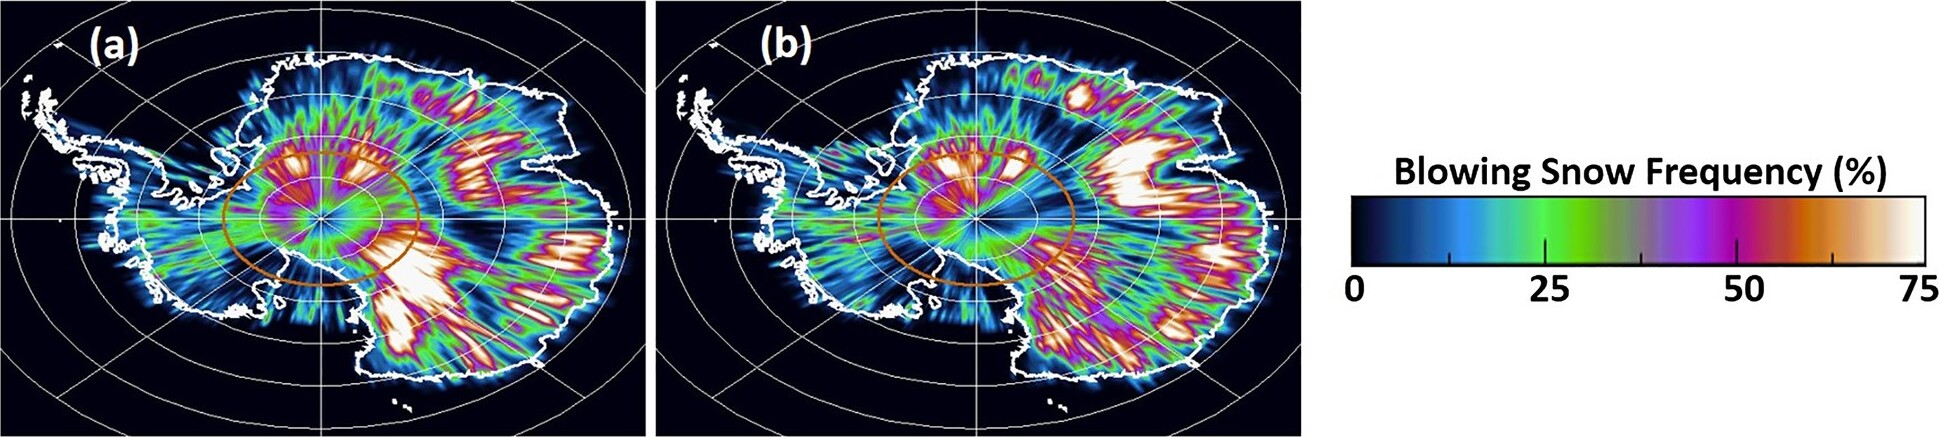
Figure 11:Atmospheric backscatter profiles from Palm et al. (2021)
ATL06: Land Ice Height Data
Contains:
- Overlapping 40-meter linear segments fit to land and land-ice photons
- Height error and segment quality estimates
Advantages:
- Lighter product than ATL03
- Provides estimated surface heights with cm-level corrections
Disadvantages:
- 40 meters is too coarse for some applications
- Only designed for single surface returns
Use if you want to:
- Make large-scale repeatable measurements of glaciers and ice sheets
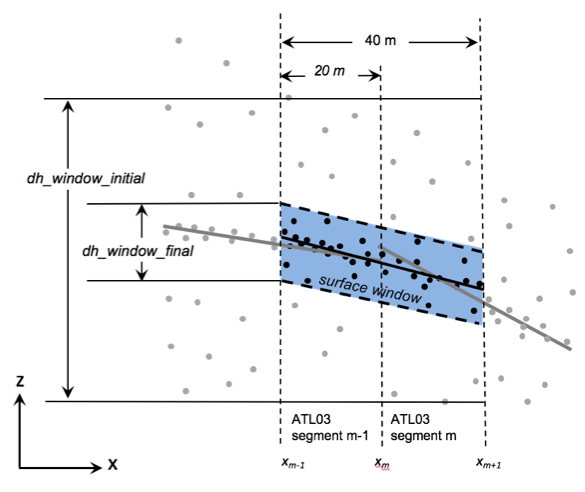
Figure 12:ATL06 segment model (Smith et al., 2019)
ATL11: Slope-Corrected Land Ice Height Time Series
Contains:
- 120-meter along-track segments for each beam pair corrected for across-track slope
- Crossover estimates from ATL06 at reference points
Advantages:
- Contains data for all cycles with along-track data following the Reference Ground Tracks (RGTs)
- Easy calculation of height change through time
Disadvantages:
- 120-m resolution is too coarse for some applications
- May not work well over complex surfaces
Use if you want to:
- Make large-scale estimates of glacier and ice sheet height change
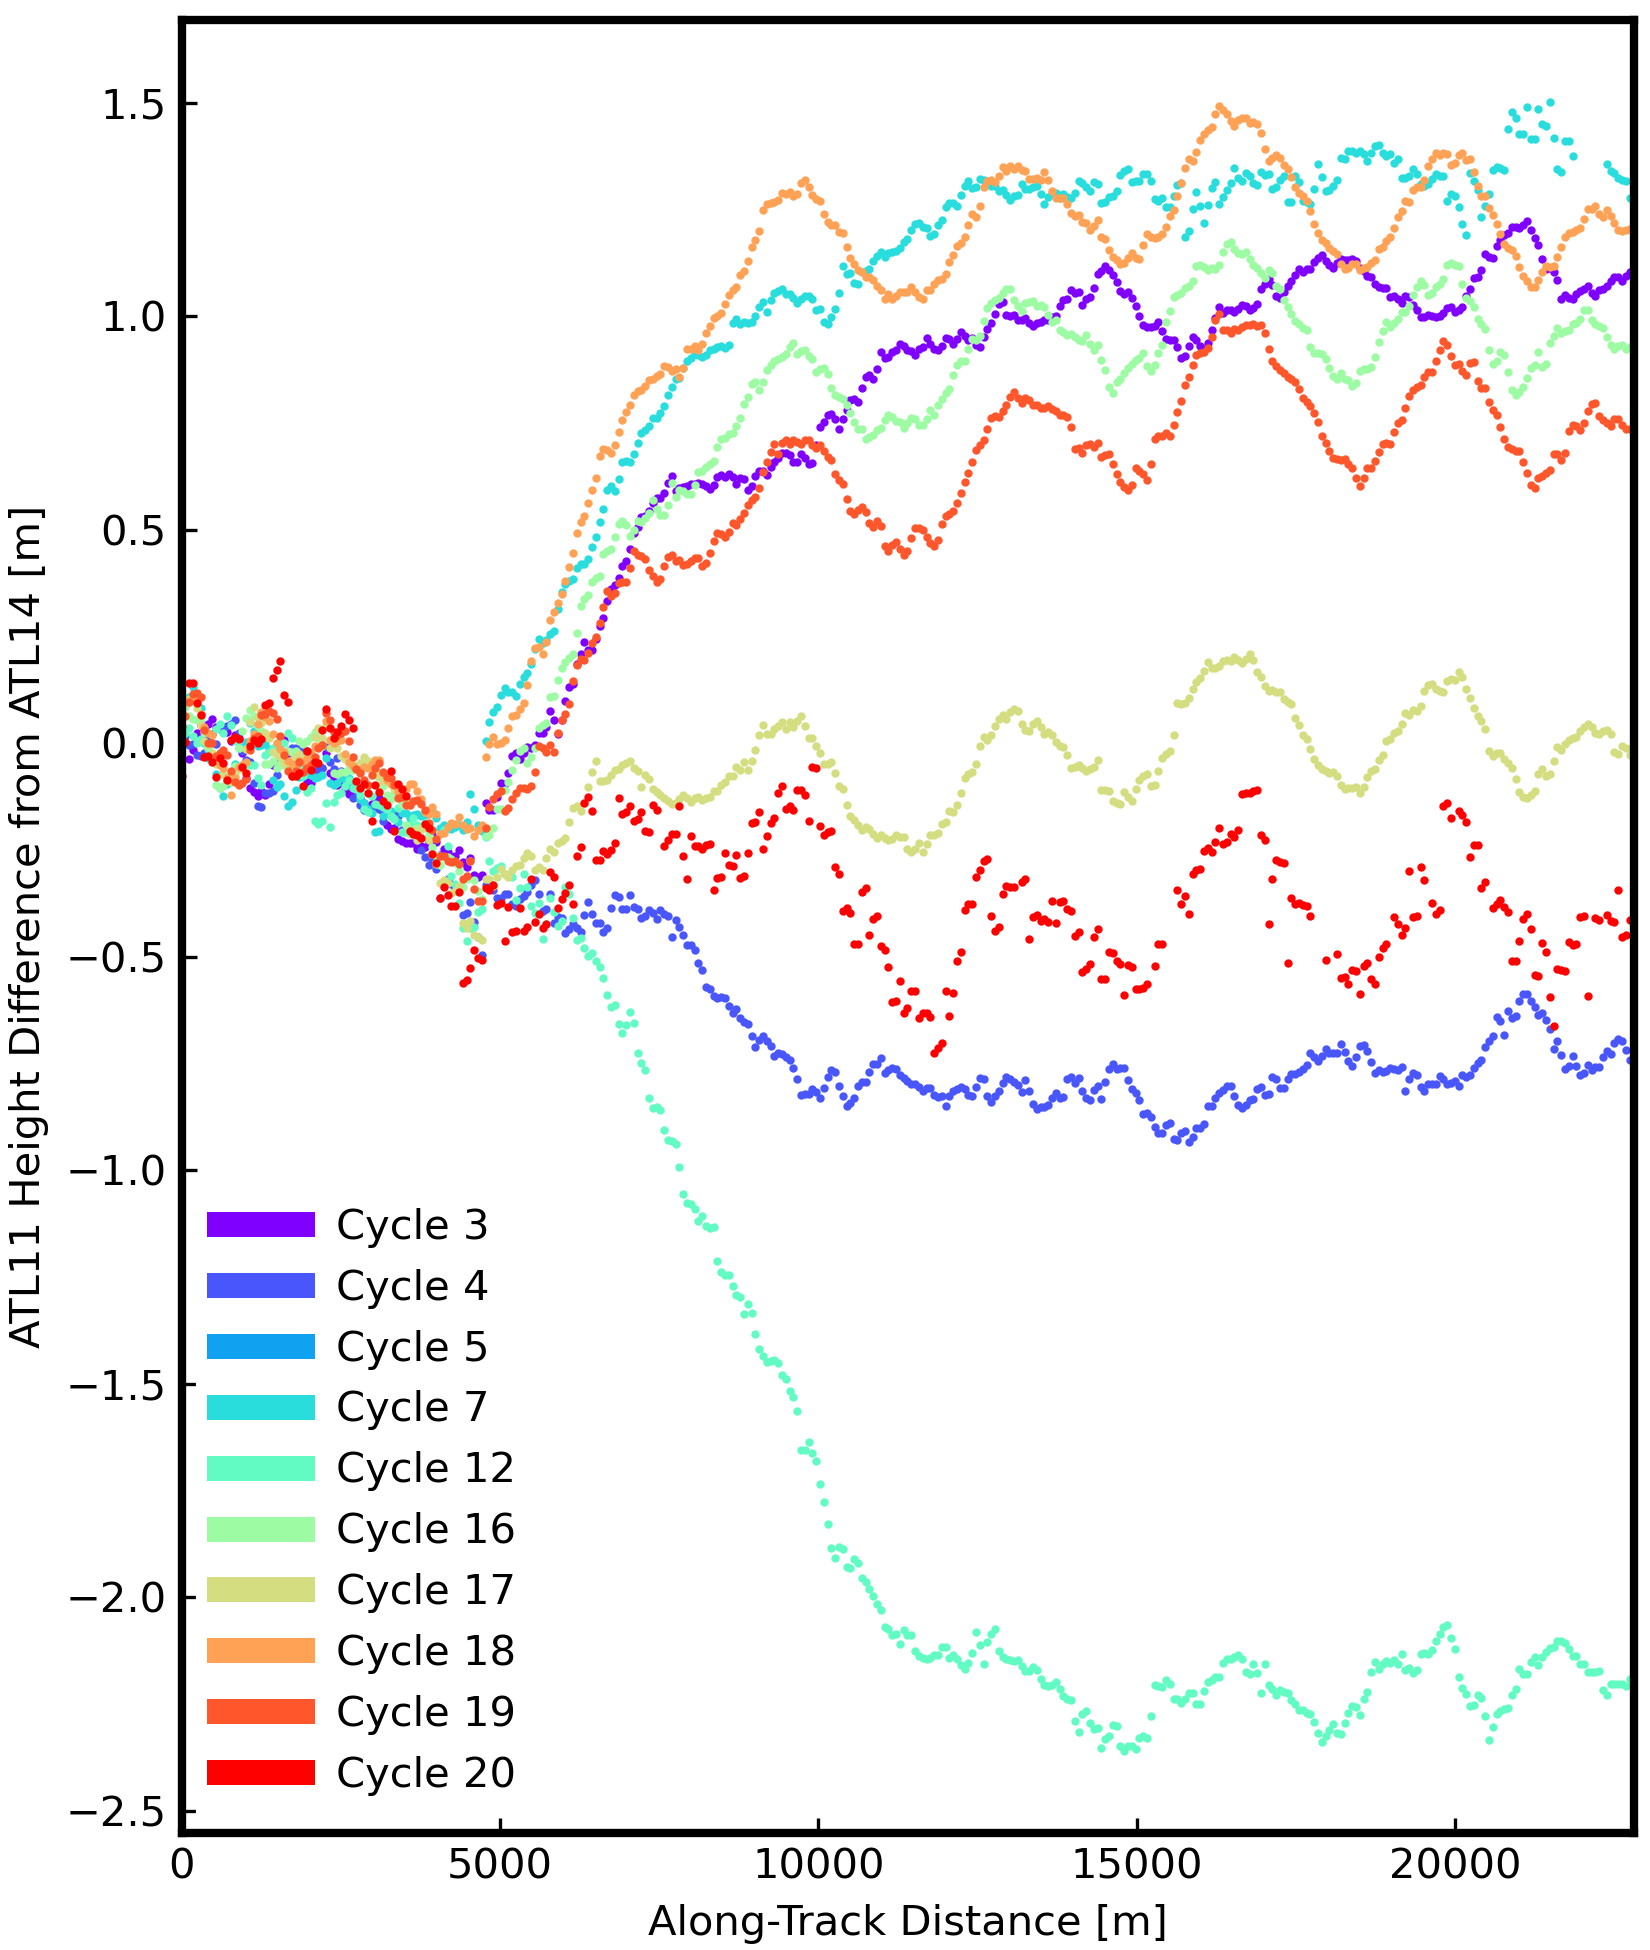
Figure 13:ATL11 height time series at an Antarctic grounding zone
ATL14 and ATL15: Gridded Land Ice Height and Height Change
Contains:
- ATL14: gridded digital elevation model (DEM) and height uncertainty at 100m posting
- ATL15: gridded land ice height change estimates at 1km, 10km, 20km, and 40km posting
Advantages:
- Gridded product combining all available along-track ATL11 data
- Simplifies volume change calculations using ICESat-2 data
Disadvantages:
- ATL14 estimates degrade where measurements are unavailable
- Quarter-annual temporal sampling might not be high enough for certain applications
Use if you want to:
- Use gridded estimates of height change for ice sheet models
- Start creating land ice mass balance estimates from ICESat-2
- Extract land ice height change estimates along transects
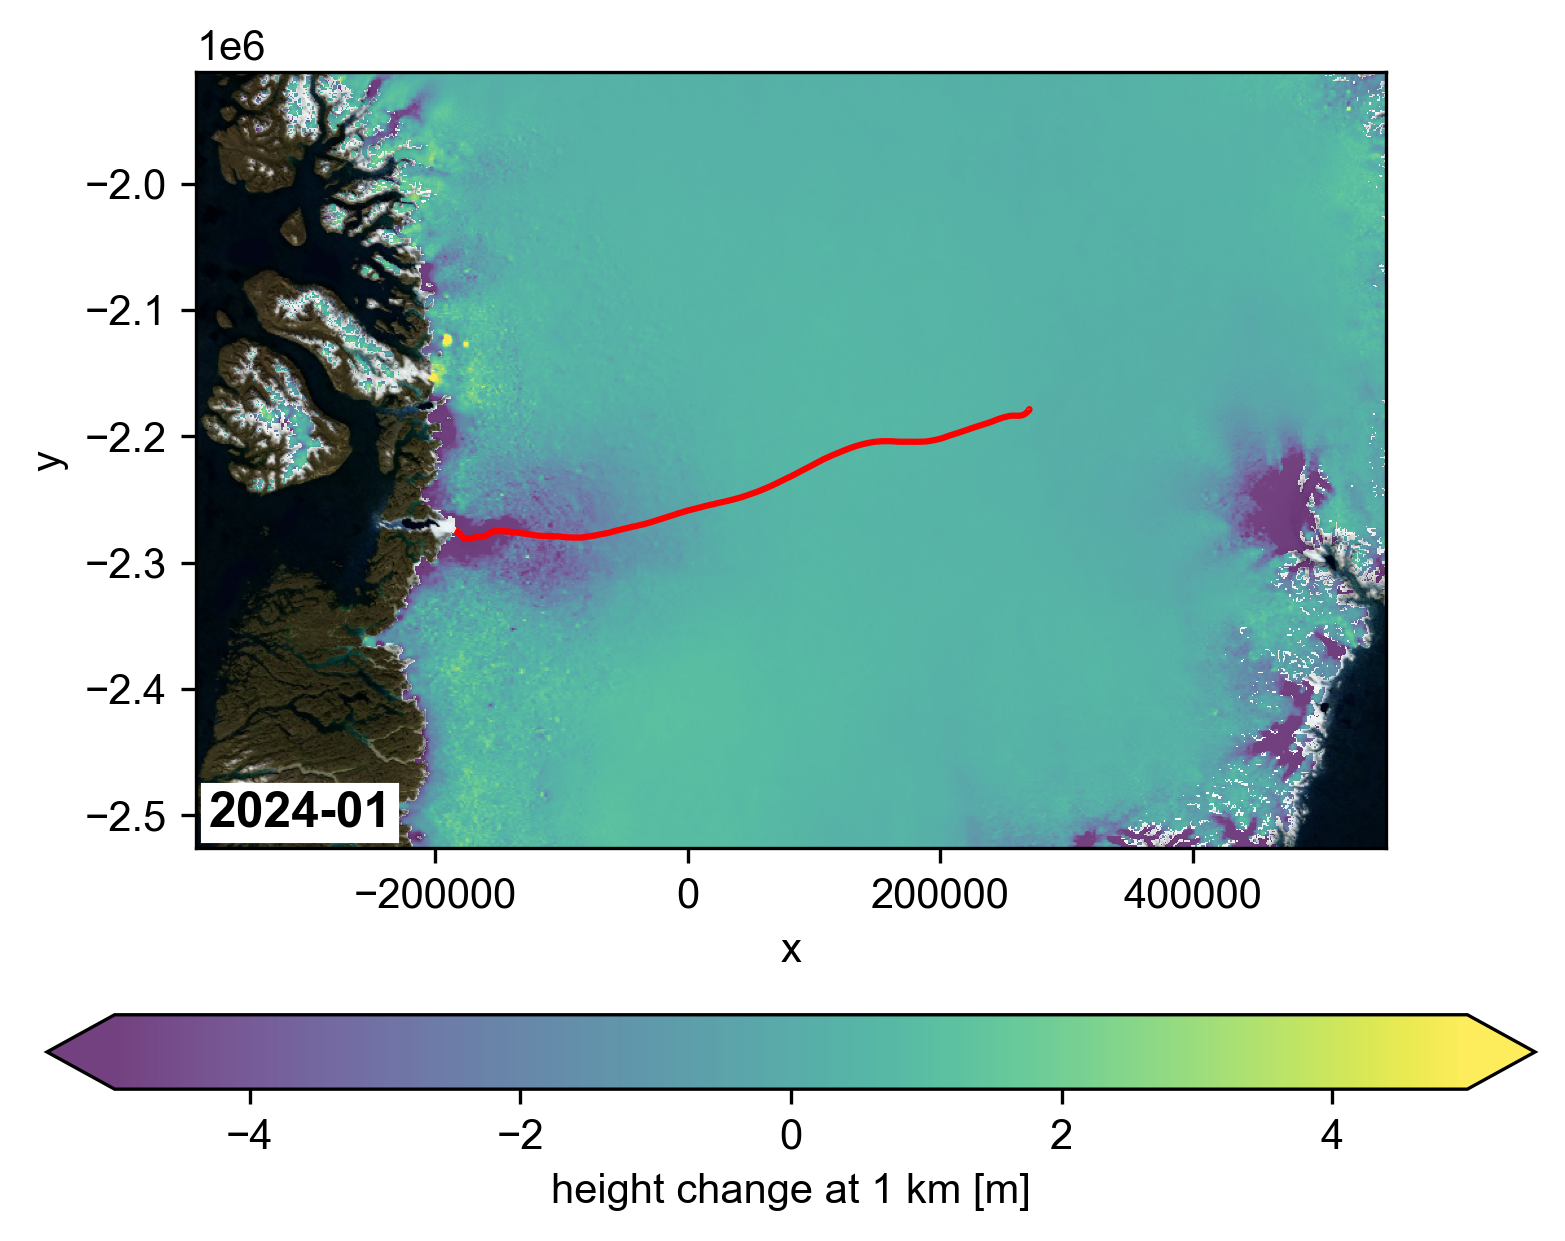
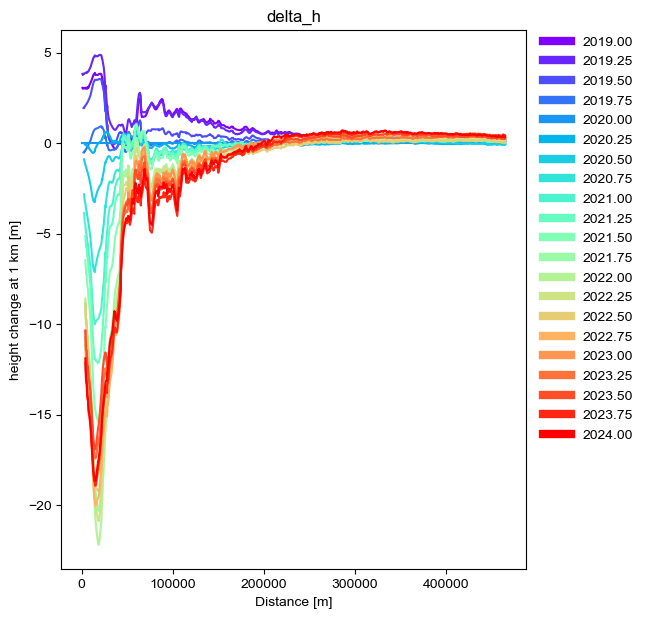
IS2view display of ATL15 height change data and extracted transect using glacier flowlines from Felikson et al. (2020).
ATL07: Sea Ice Height Data
Contains:
- Along-track heights for sea ice and leads
Advantages:
- High precision (~2 cm) height retrievals from 150-photon aggregates
- Classifications for varying surface types (e.g. open water leads, sea ice)
- Provides auxiliary information such as surface roughness and retrieval quality flags
Disadvantages:
- Surface retrievals have varying length scales
- Surface type flagging is still in development
Use if you want to:
- Have base level surface heights for freeboard or surface process studies
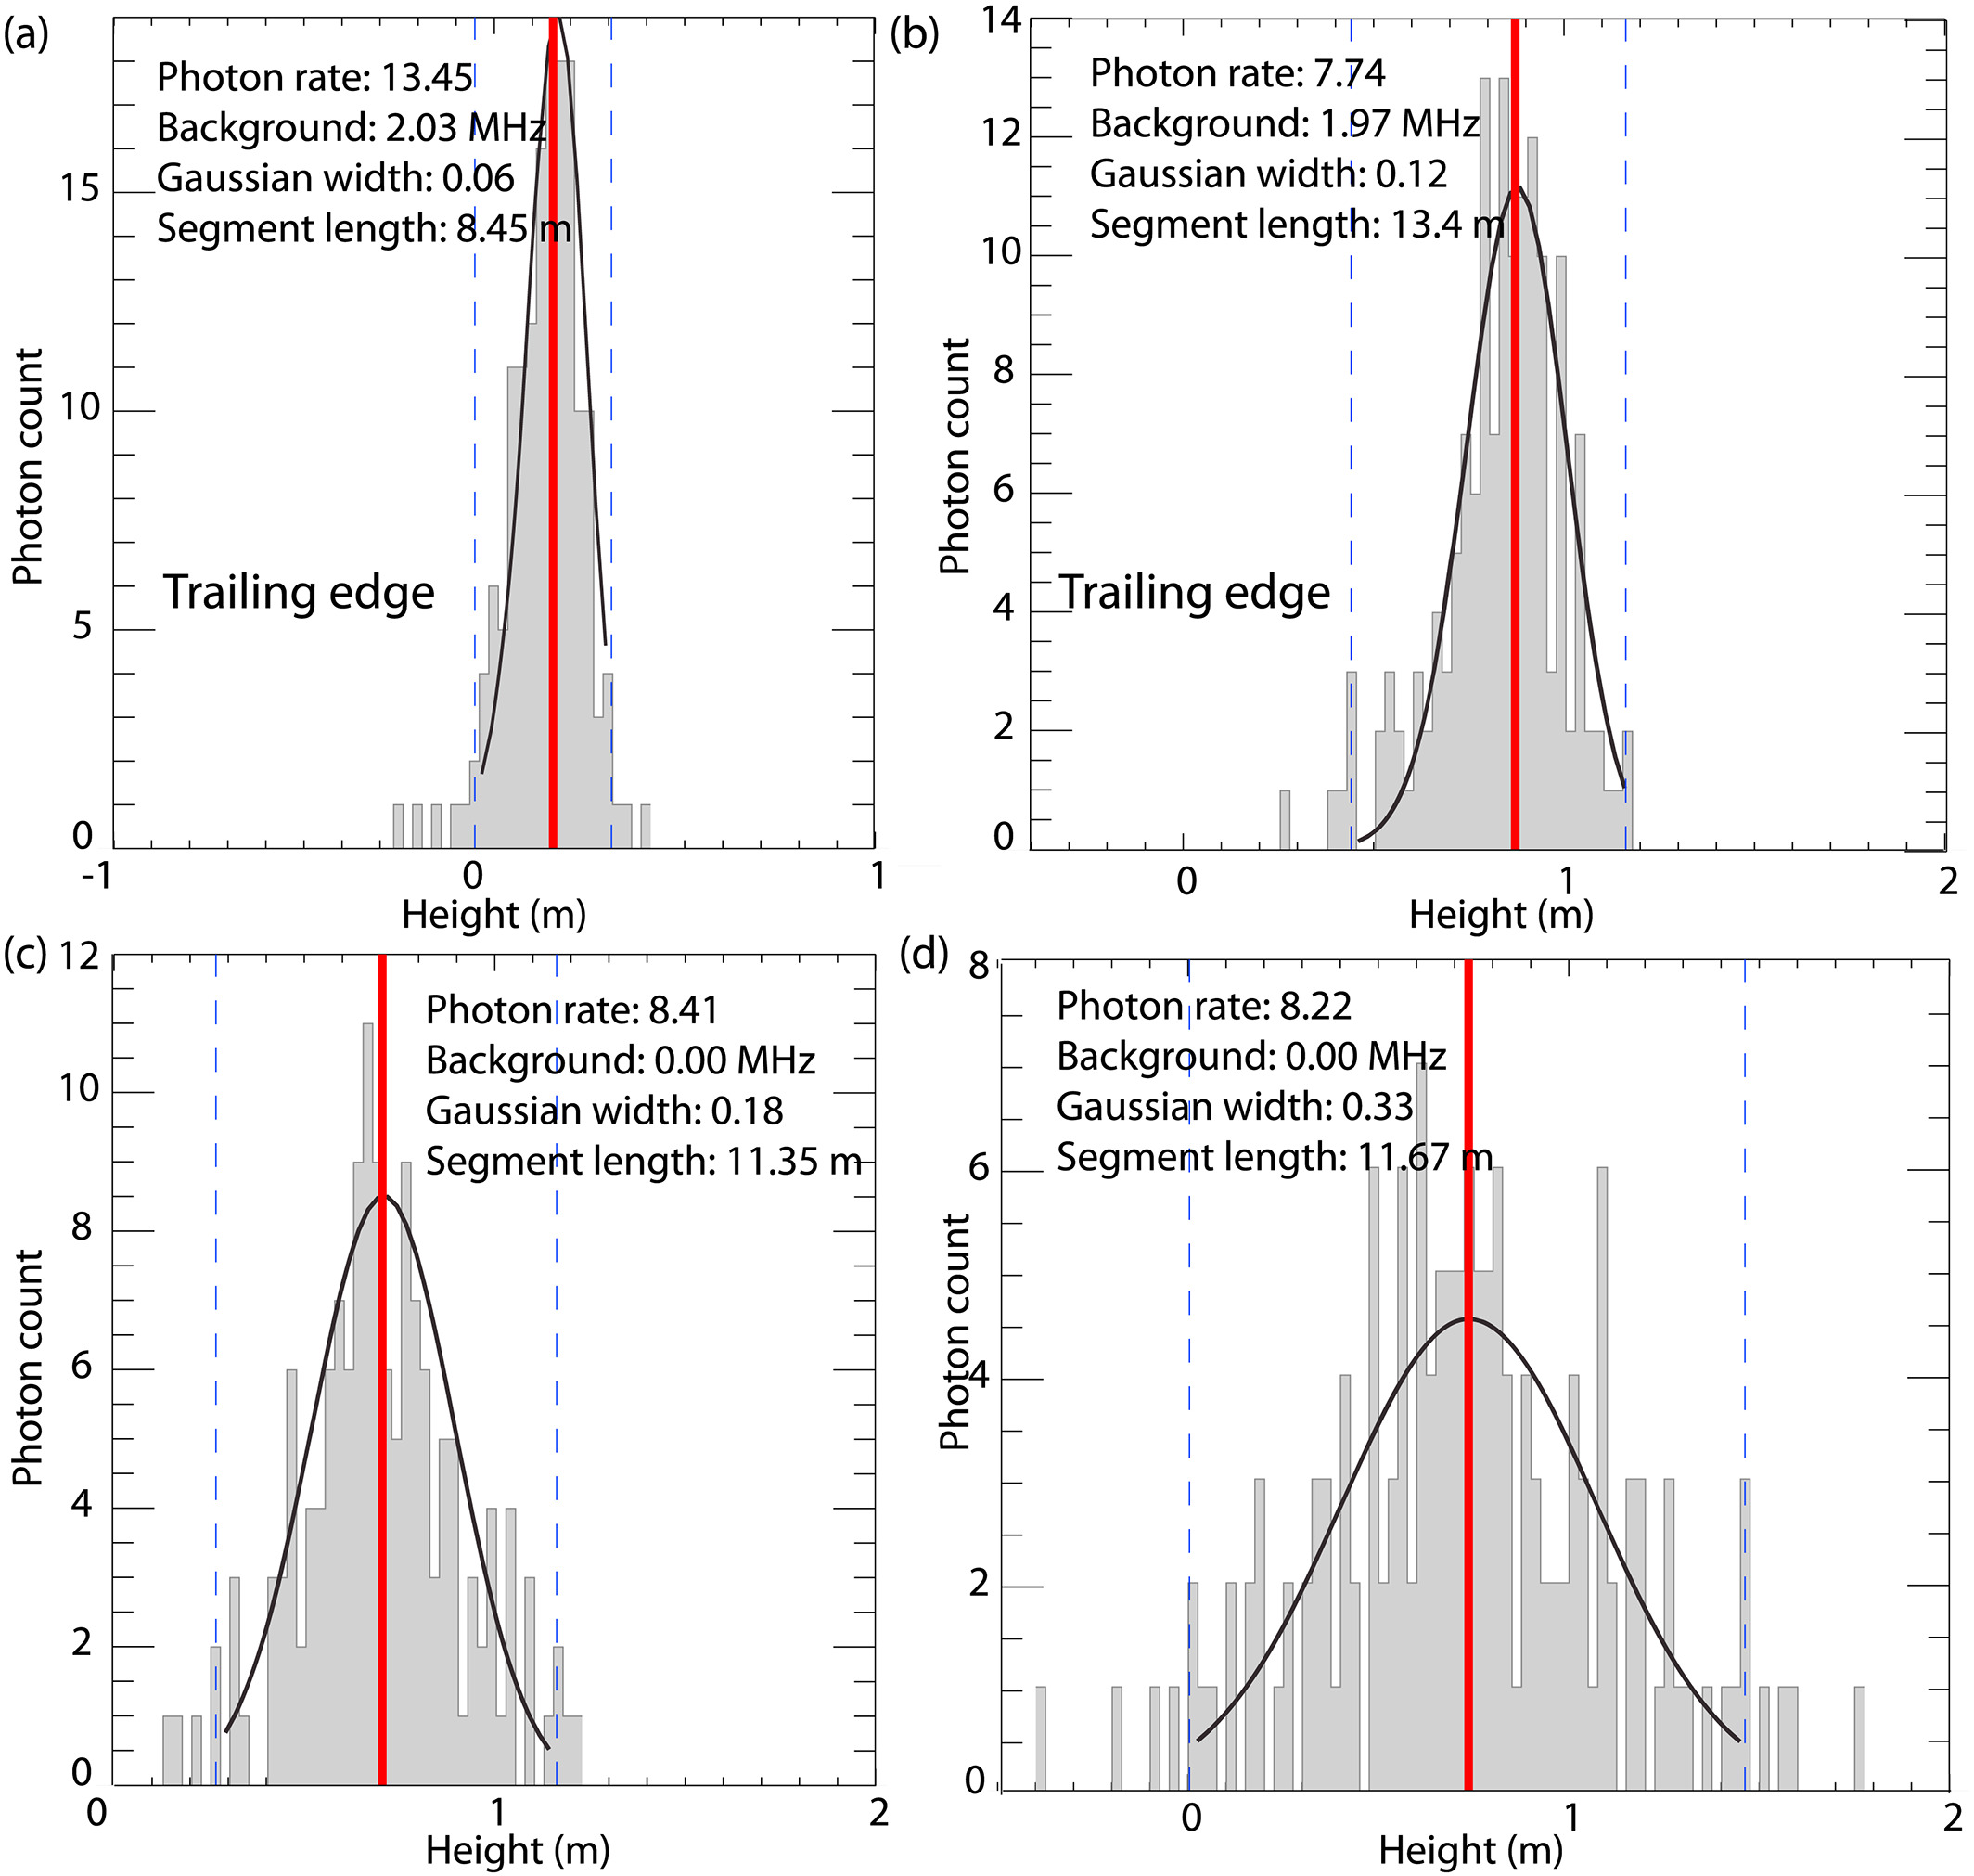
Figure 14:ATL07 sea ice heights from Kwok et al. (2019)
ATL10: Sea Ice Freeboard Data
Contains:
- Along-track sea ice freeboard and surface heights
- Surface type flagging and ancillary information
Advantages:
- Lighter product than ATL07 with higher level freeboard and surface types
Disadvantages:
- Higher levels of missing/invalid data than ATL07 (low ice concentration, near-coastal)
- Varying length scales of retrievals
- Summer sea ice retrievals still under investigation (July 2022 field campaign)
Use if you want to:
- Use along-track freeboard retrievals
- Use a highly accurate product (3 cm or better over 25 km length scales)
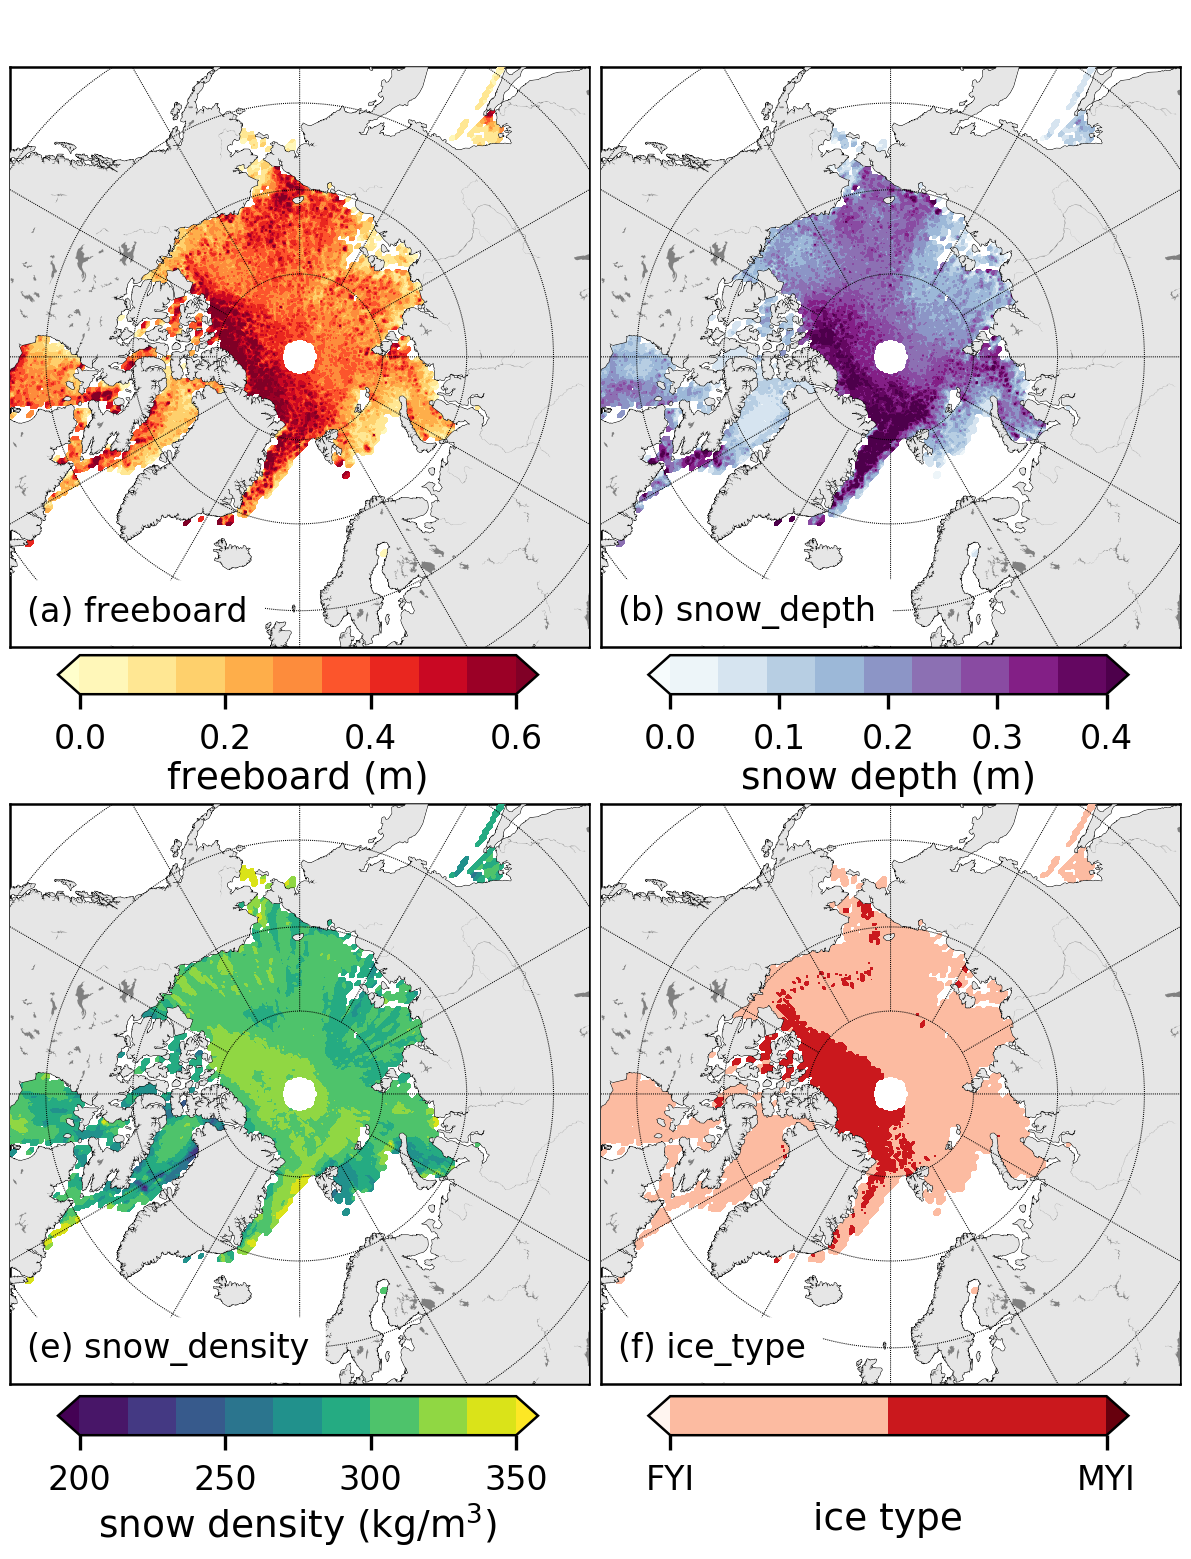
Figure 15:ATL10 sea ice freeboards from Petty et al. (2020)
ATL20: Gridded Sea Ice Freeboard Data
Contains:
- 25 km gridded sea ice freeboard at daily to monthly resolution
Advantages:
- Gridded product that is lighter than ATL10
Disadvantages:
- Coarse length scale, averages out the high resolution of the ICESat-2 data
Use if you want to:
- Look at gridded sea ice freeboard data for large-scale determination of sea ice change
- Merge with other coarse-resolution data such as passive microwave products
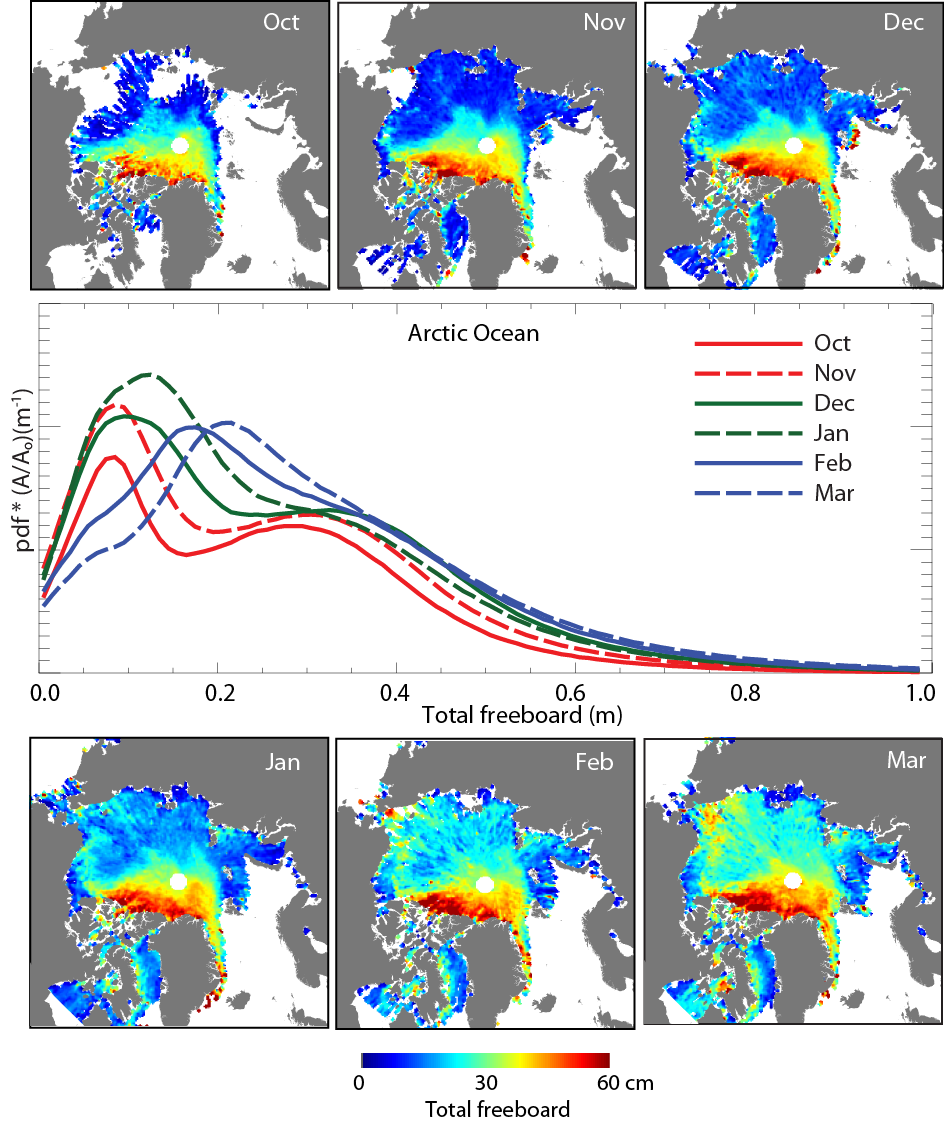
Figure 16:ATL20 gridded freeboard from Kwok et al. (2019)
ATL21: Gridded Polar Sea Surface Height Data
Contains:
- 25 km gridded sea surface height anomalies for sea ice covered regions
Advantages:
- Gridded product that is lighter than ATL10
- Uses a sophisticated sea surface height retrieval algorithm to detect leads in polar oceans
Disadvantages:
- Coarse length scale, averages out the high resolution of the ICESat-2 data
- Only data from center strong beam available due to time and spatially varying biases
Use if you want to:
- Look at large-scale gridded sea surface height anomalies or derive dynamic ocean topography in polar regions
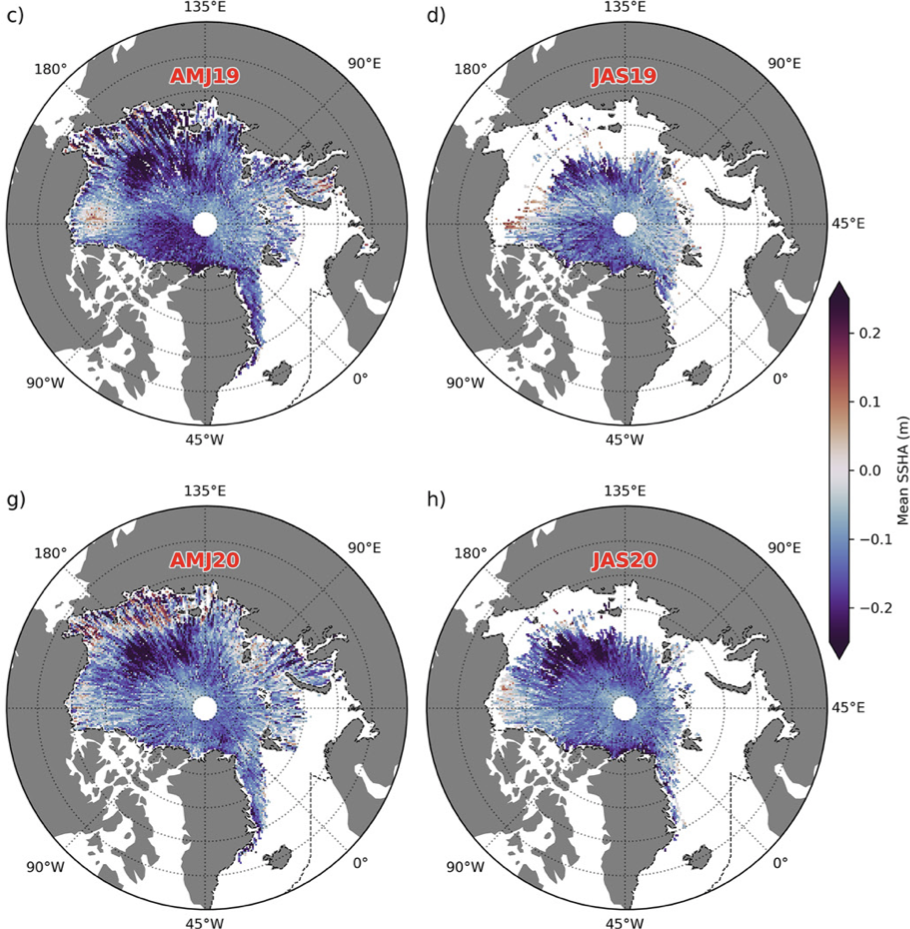
Figure 17:ATL21 sea surface heights from Bagnardi et al. (2021)
ATL08: Land and Vegetation Height Data
Contains:
- Terrain surface and canopy heights from land photons
Advantages:
- Can handle surfaces with multiple returns (such as vegetated canopies)
- Provides photon-level classifications from the ATL08 algorithm
Disadvantages:
- Can produce less reliable results over sloping surfaces
Use if you want to:
- Detect multiple surfaces, such as vegetated canopies or supraglacial lakes
- Look at vegetated terrain and need to detect the ground
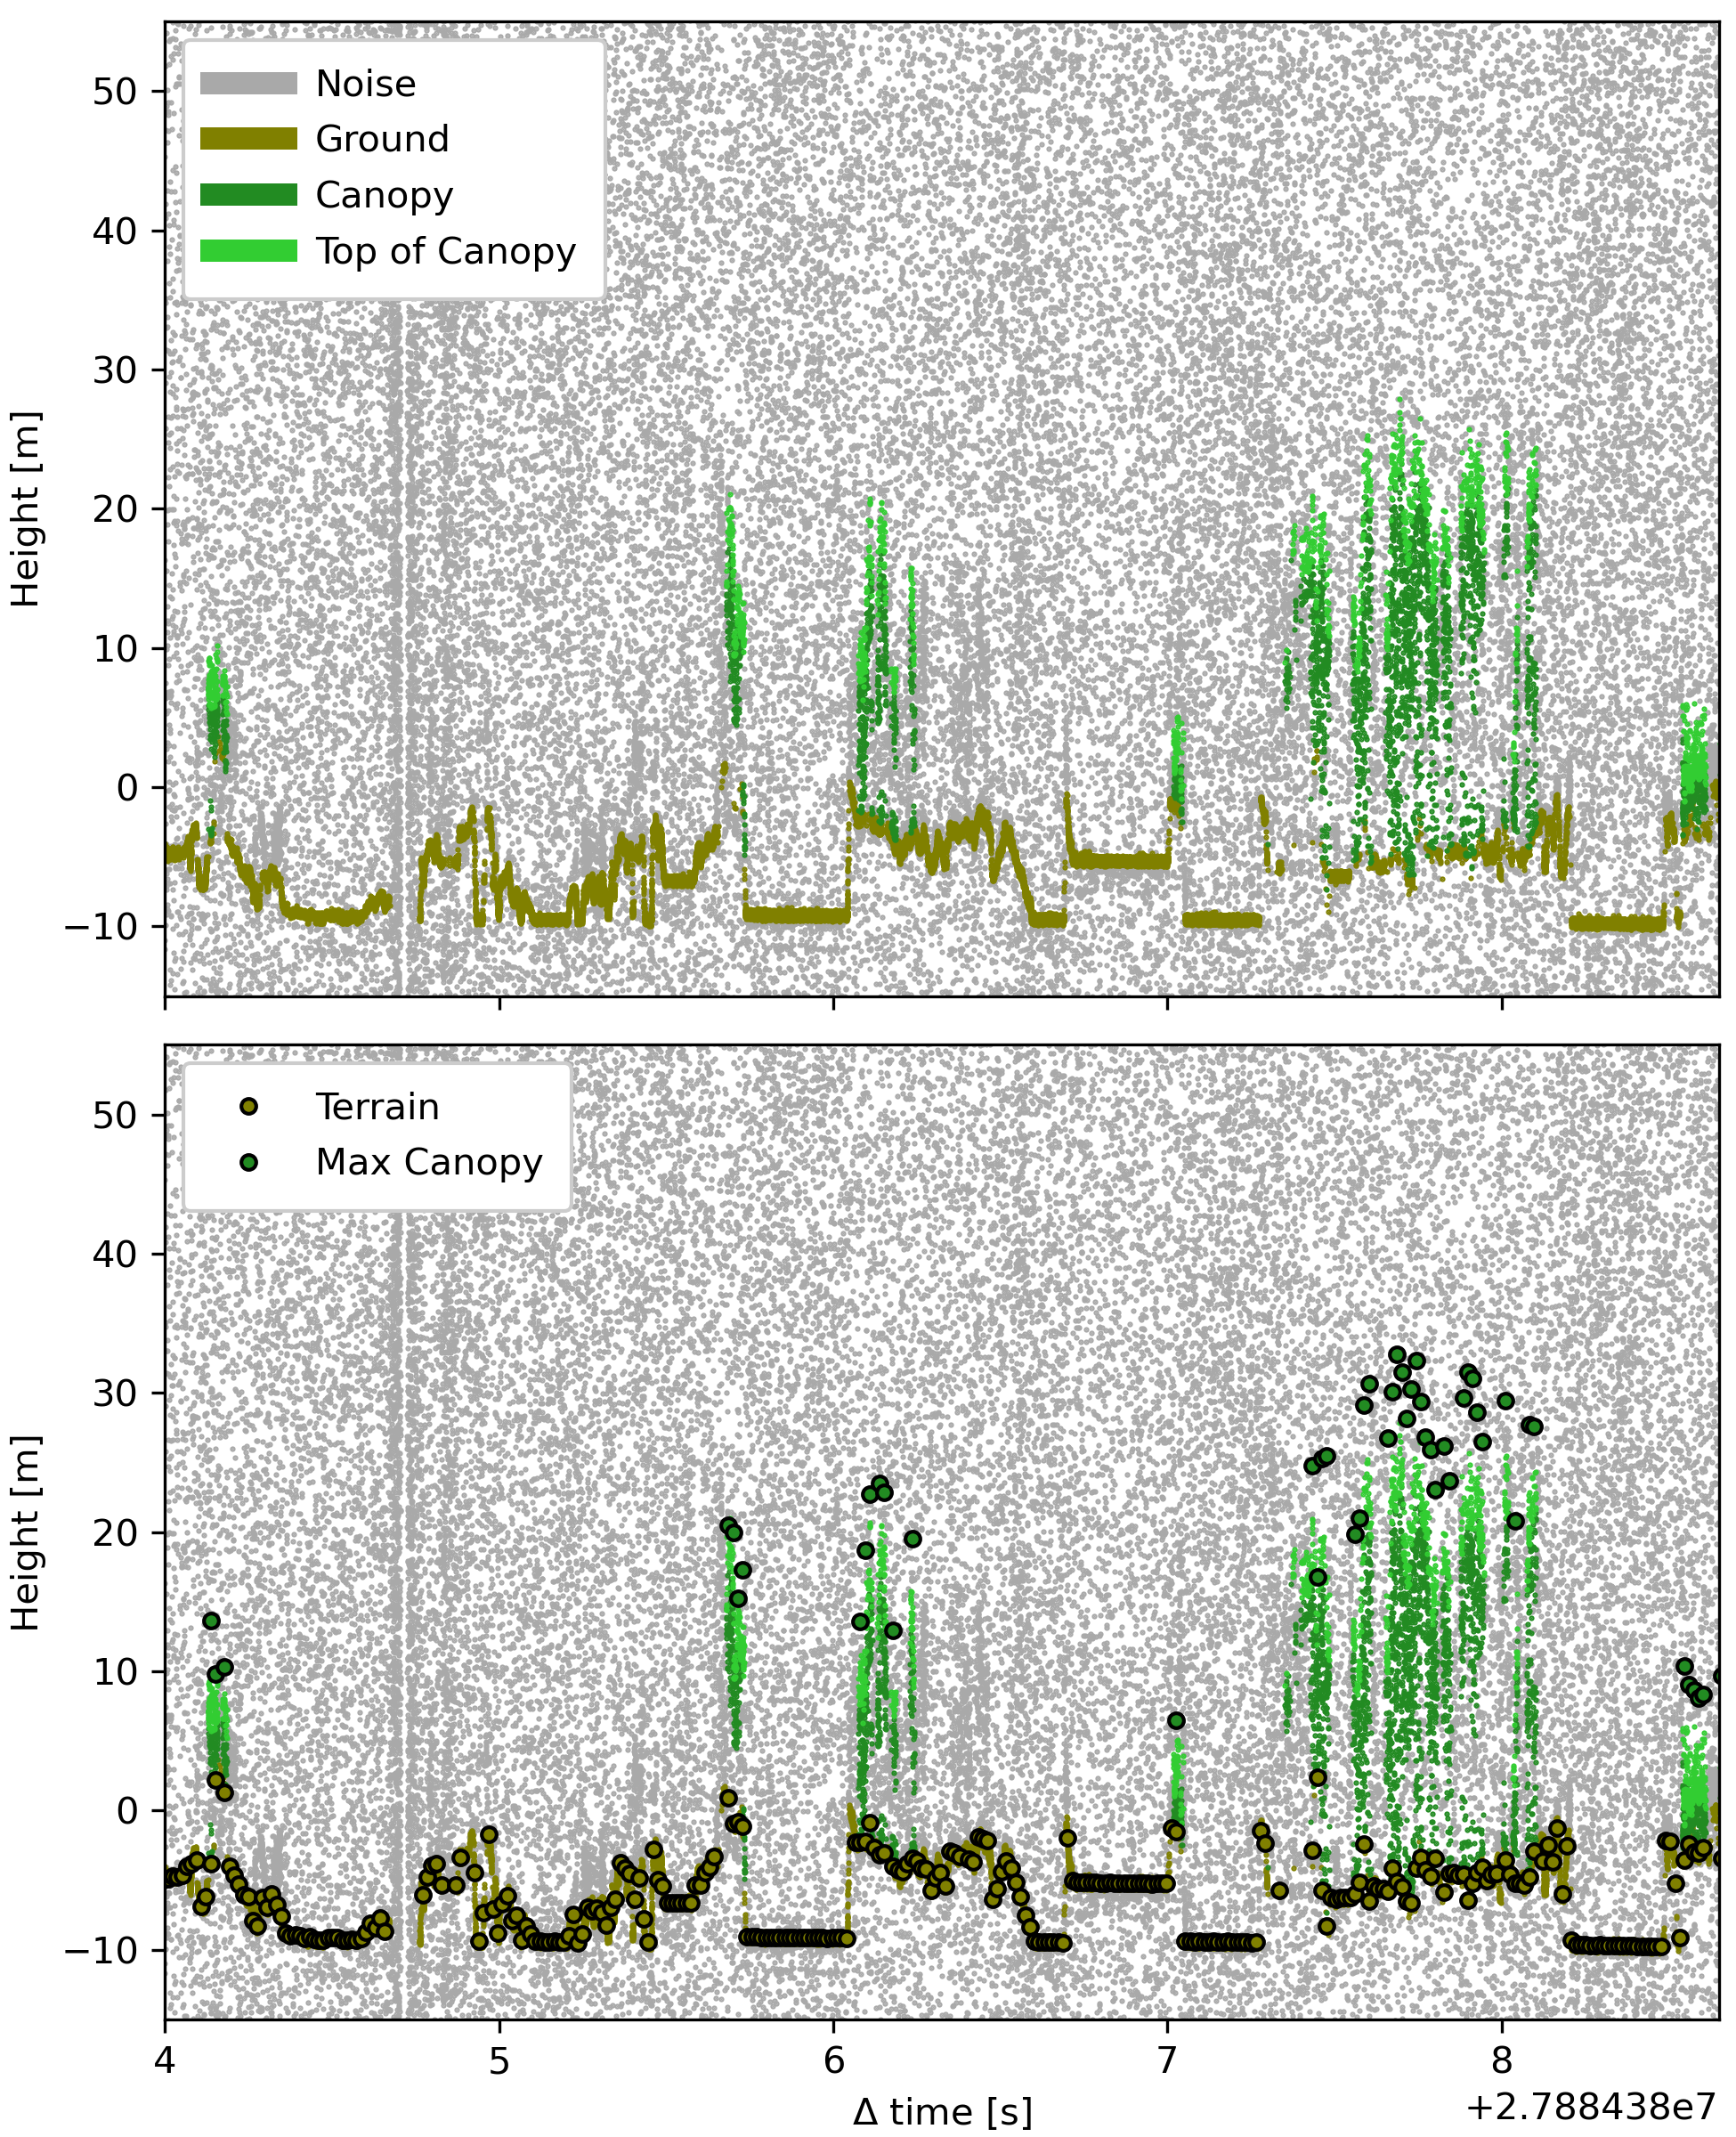
Figure 18:ATL08 vegetation heights (recreated a figure from Amy Neuenschwander, UT Austin)
ATL18: Gridded Land and Vegetation Height (in development)
Contains:
- Terrain and relative canopy heights at 1km resolution
Advantages:
- Uses EASE2.0 grids for compatibility with other datasets
- Will be updated annually
Disadvantages:
- Low spatial resolution limits creating a temporal change product
Use if you want to:
- Analyze large-scale vegetation and land surface change
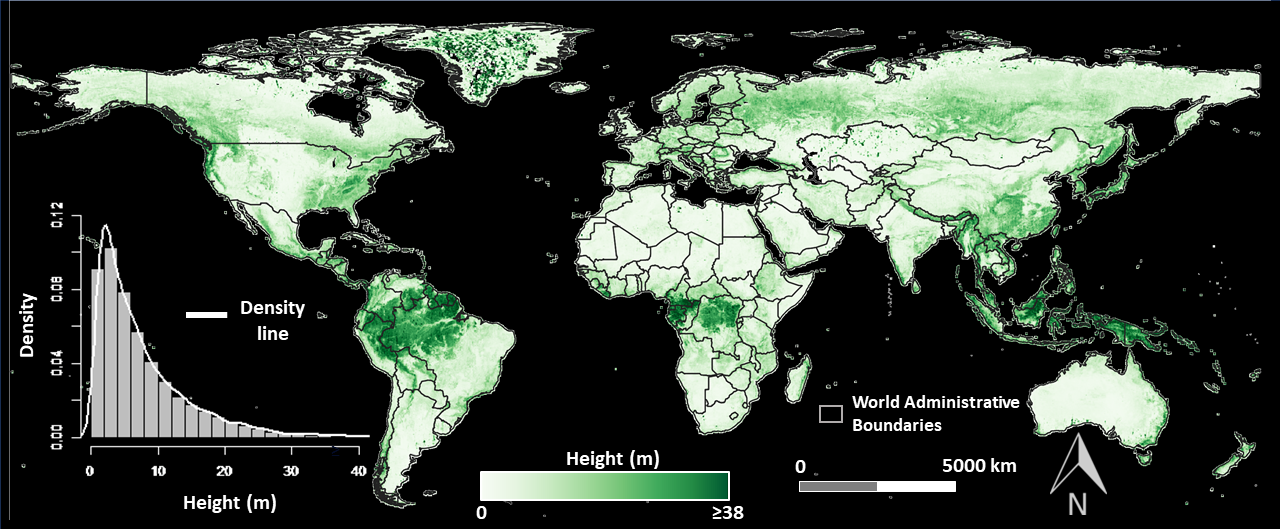
Figure 19:ATL18 gridded vegetation height (provided by Amy Neuenschwander, UT Austin)
ATL12: Ocean Surface Height Data
Contains:
- Sea surface heights for oceans deeper than 10m
- Harmonic coefficients and statistics for waves
- Geophysical (e.g. sea state bias) corrections
Advantages:
- Average height estimates reduce the effects of correlated noise due to waves
- Also provides sea surface heights with cm-level corrections at spatial resolutions up to 10m
Disadvantages:
- Does not represent the sea surface in ice covered areas
Use if you want to:
- Detect the instantaneous sea surface height
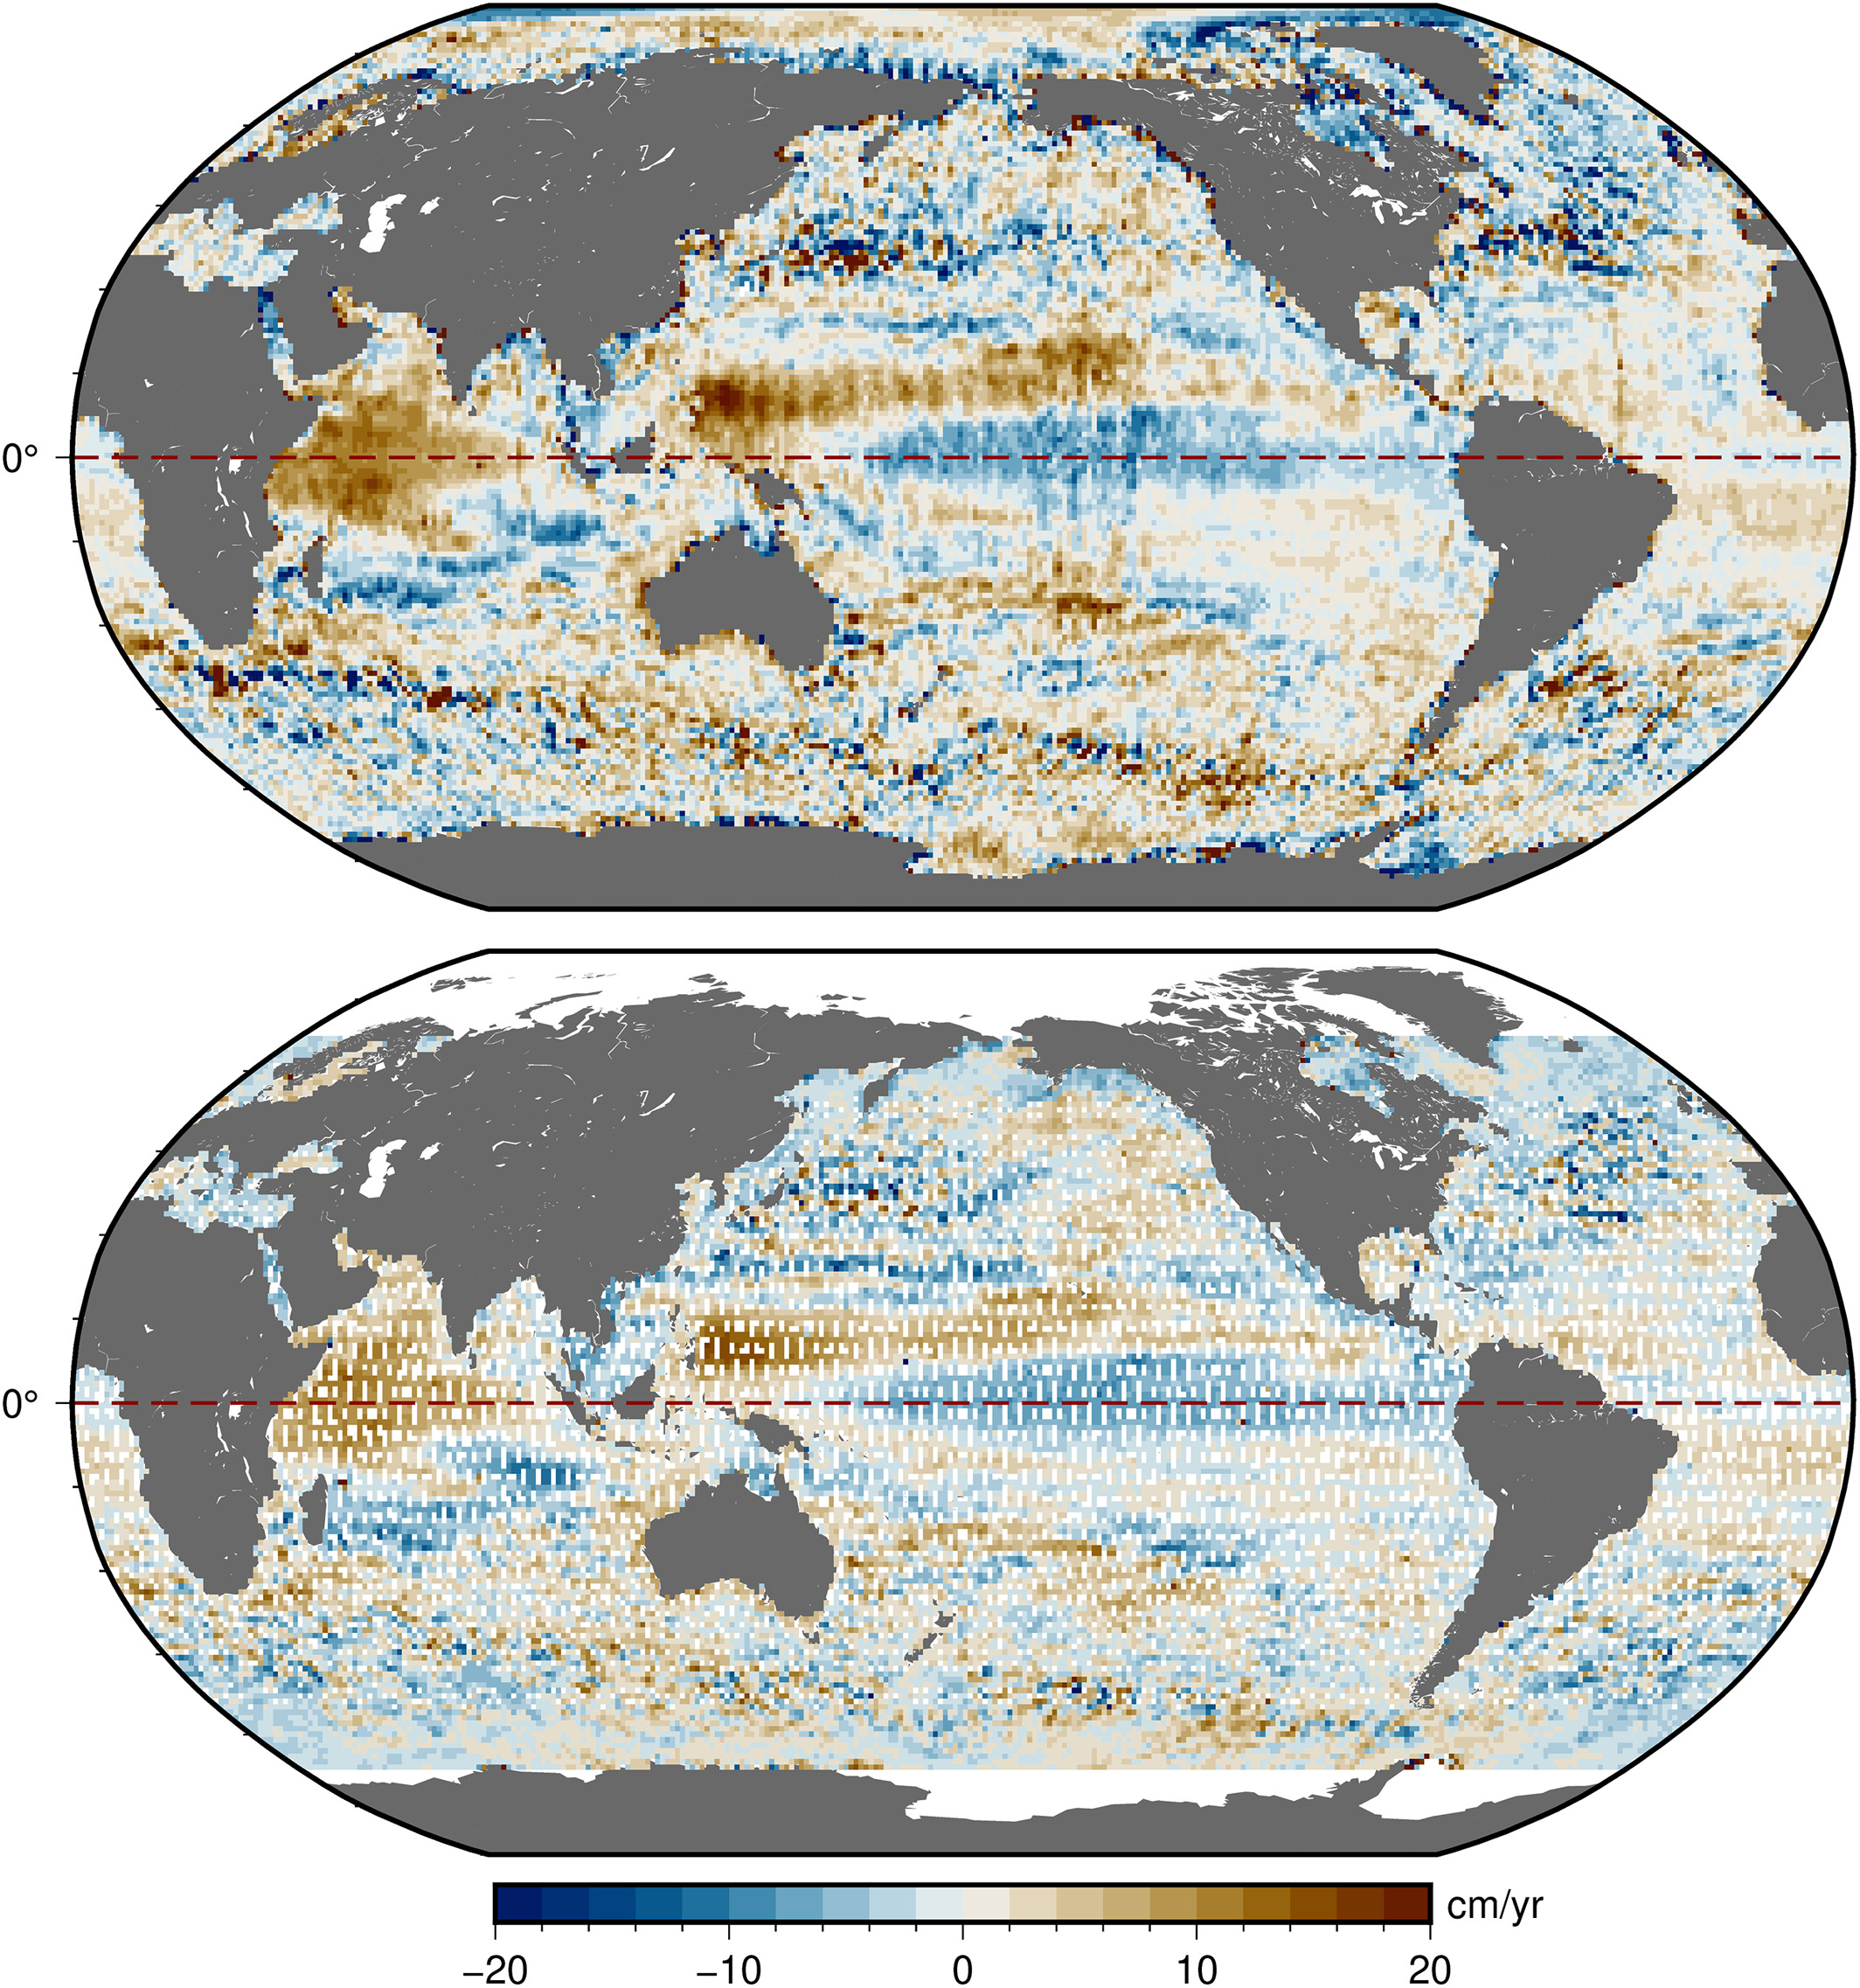
Figure 20:Comparison of ATL12 and JASON-3 from Buzzanga et al. (2021)
ATL19 and ATL23: Gridded Dynamic Ocean Topography
Contains:
- Rasterized DOT at ¼° (mid-latitudes) and 25 km (polar) spatial resolution
- Monthly (ATL19) and tri-monthly (ATL23) temporal resolution
Advantages:
- Lighter product than ATL12
- Includes individual beam averages
Disadvantages:
- Lower temporal resolution than ATL12
Use if you want to:
- Calculate the average DOT over time
- Look at large-scale oceanographic features
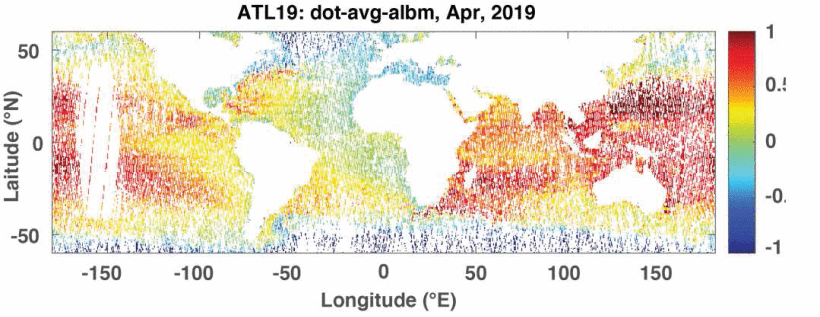
Figure 21:ATL19 dynamic ocean topography
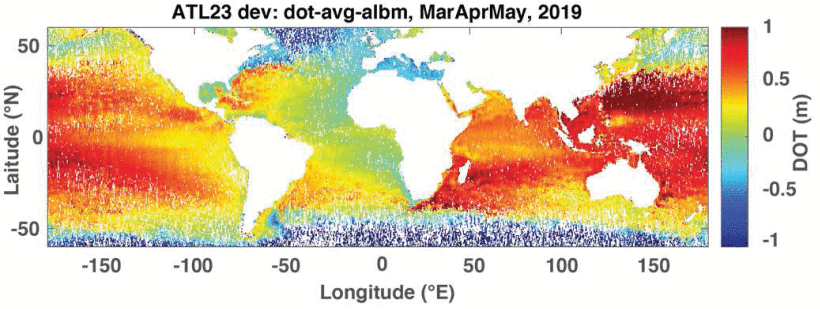
Figure 22:ATL23 dynamic ocean topography
ATL19 and ATL23 DOT from Figures 4 and 5 of Morison et al. (2022)
Product Information at the National Snow and Ice Data Center (NSIDC)
- The NSIDC DAAC is the primary data manager for ICESat-2 data
- On-prem data stores
- Cloud-based data stores (AWS s3)
- Mission landing page for ICESat-2 → https://
nsidc .org /data /icesat-2 - Product landing pages (e.g. ATL03) → https://
nsidc .org /data /atl03
Part 3: Mission Status and Future
ICESat-2 Mission Status
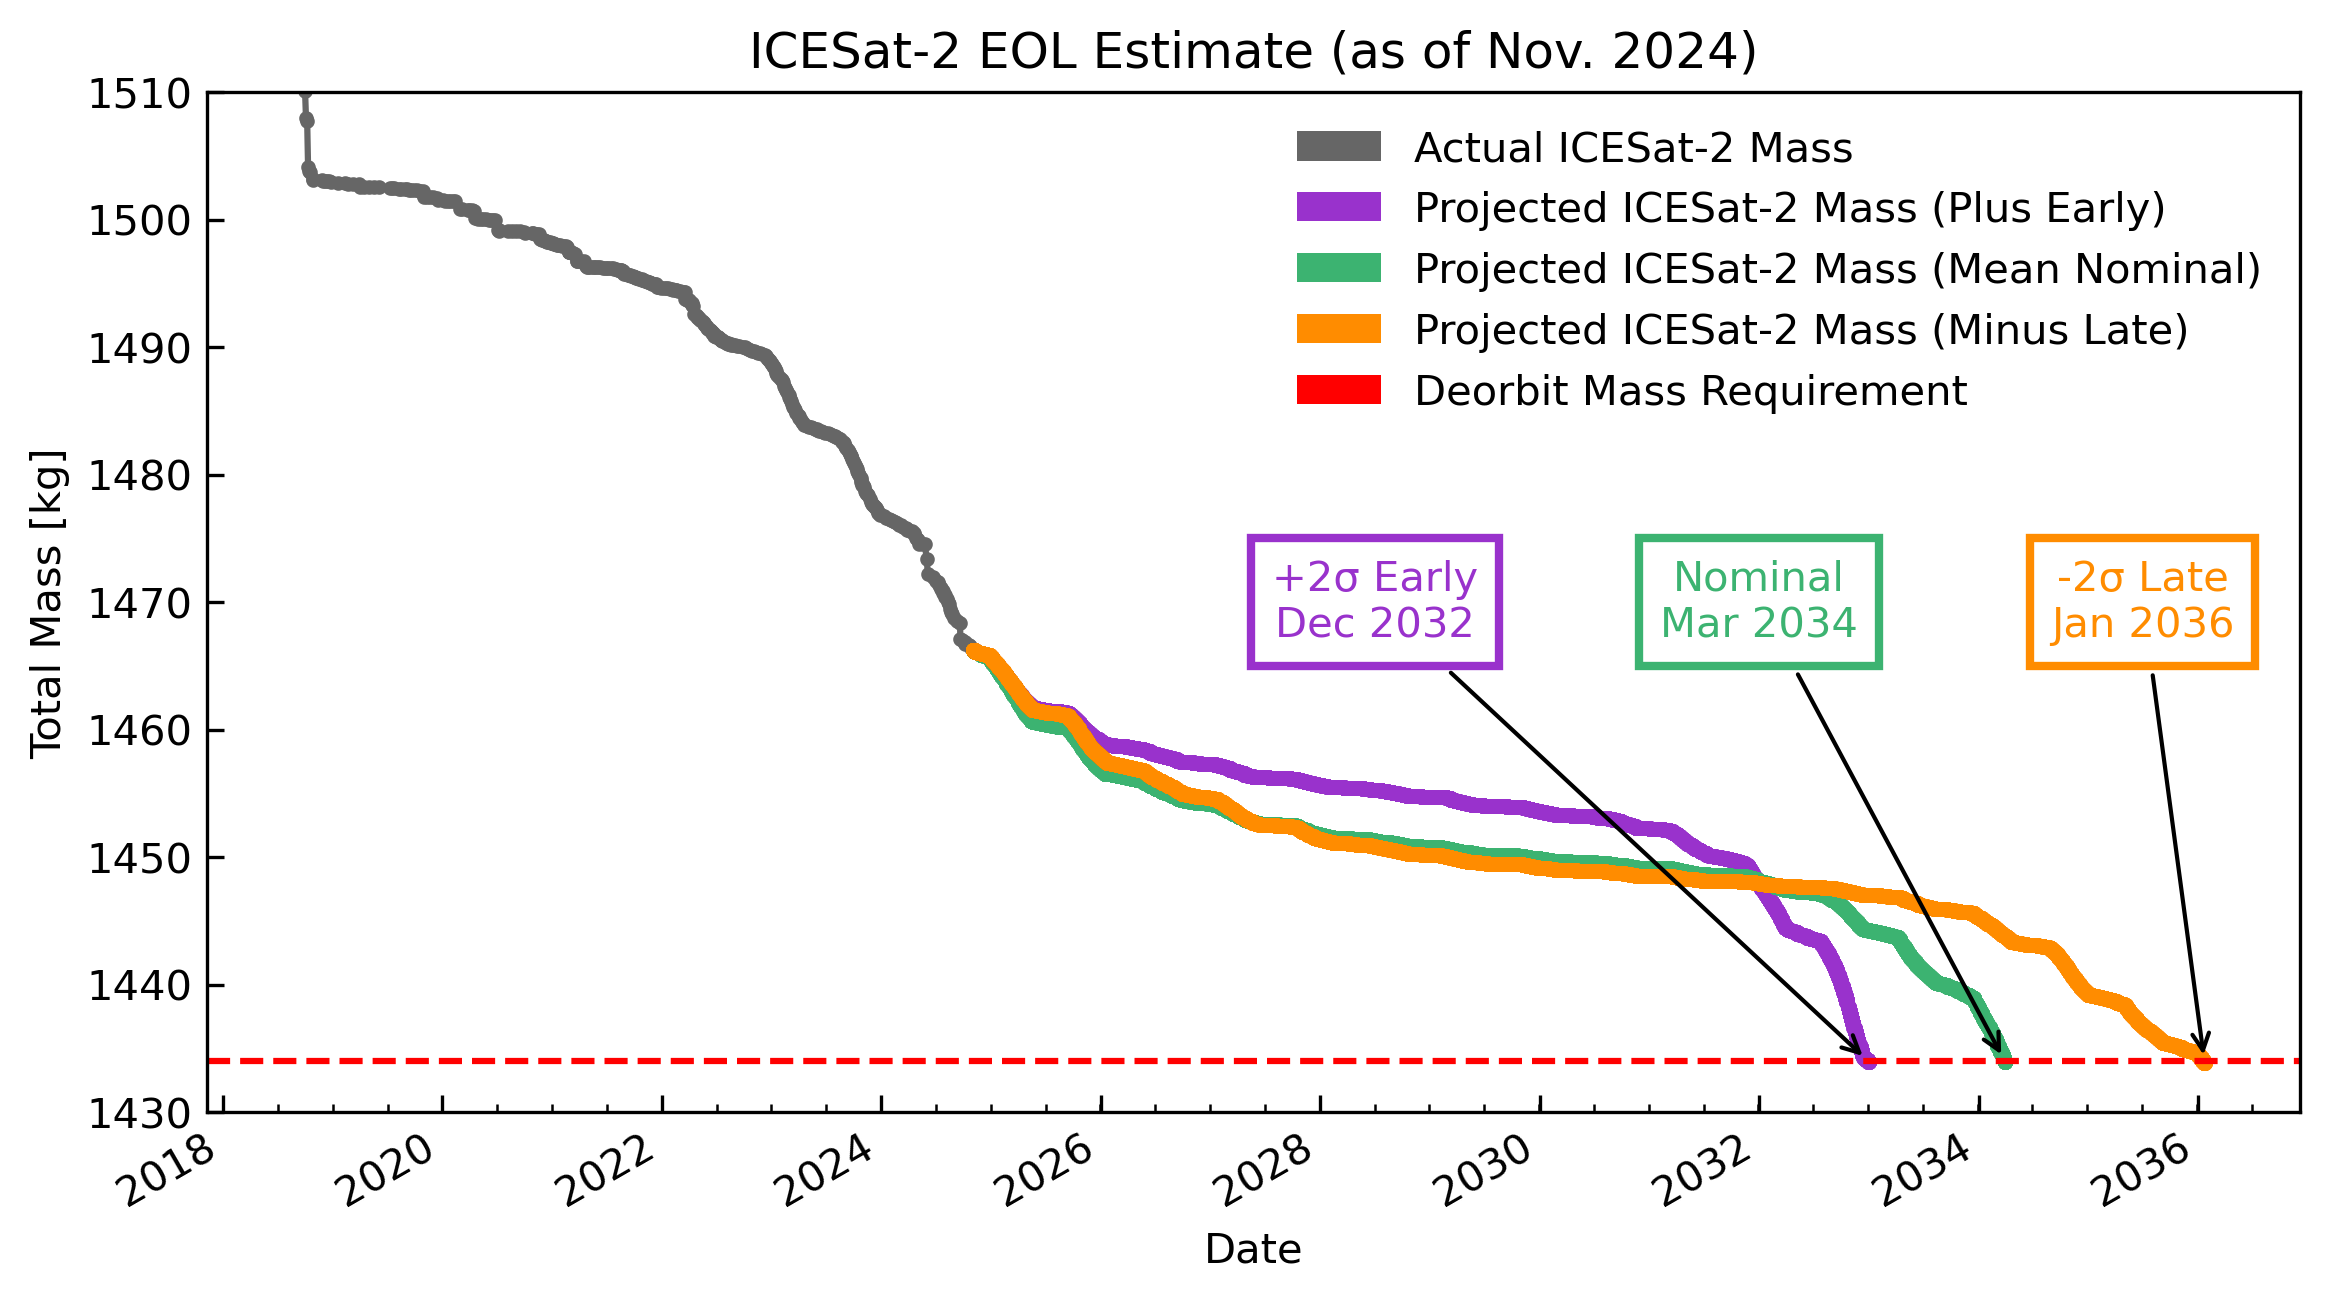
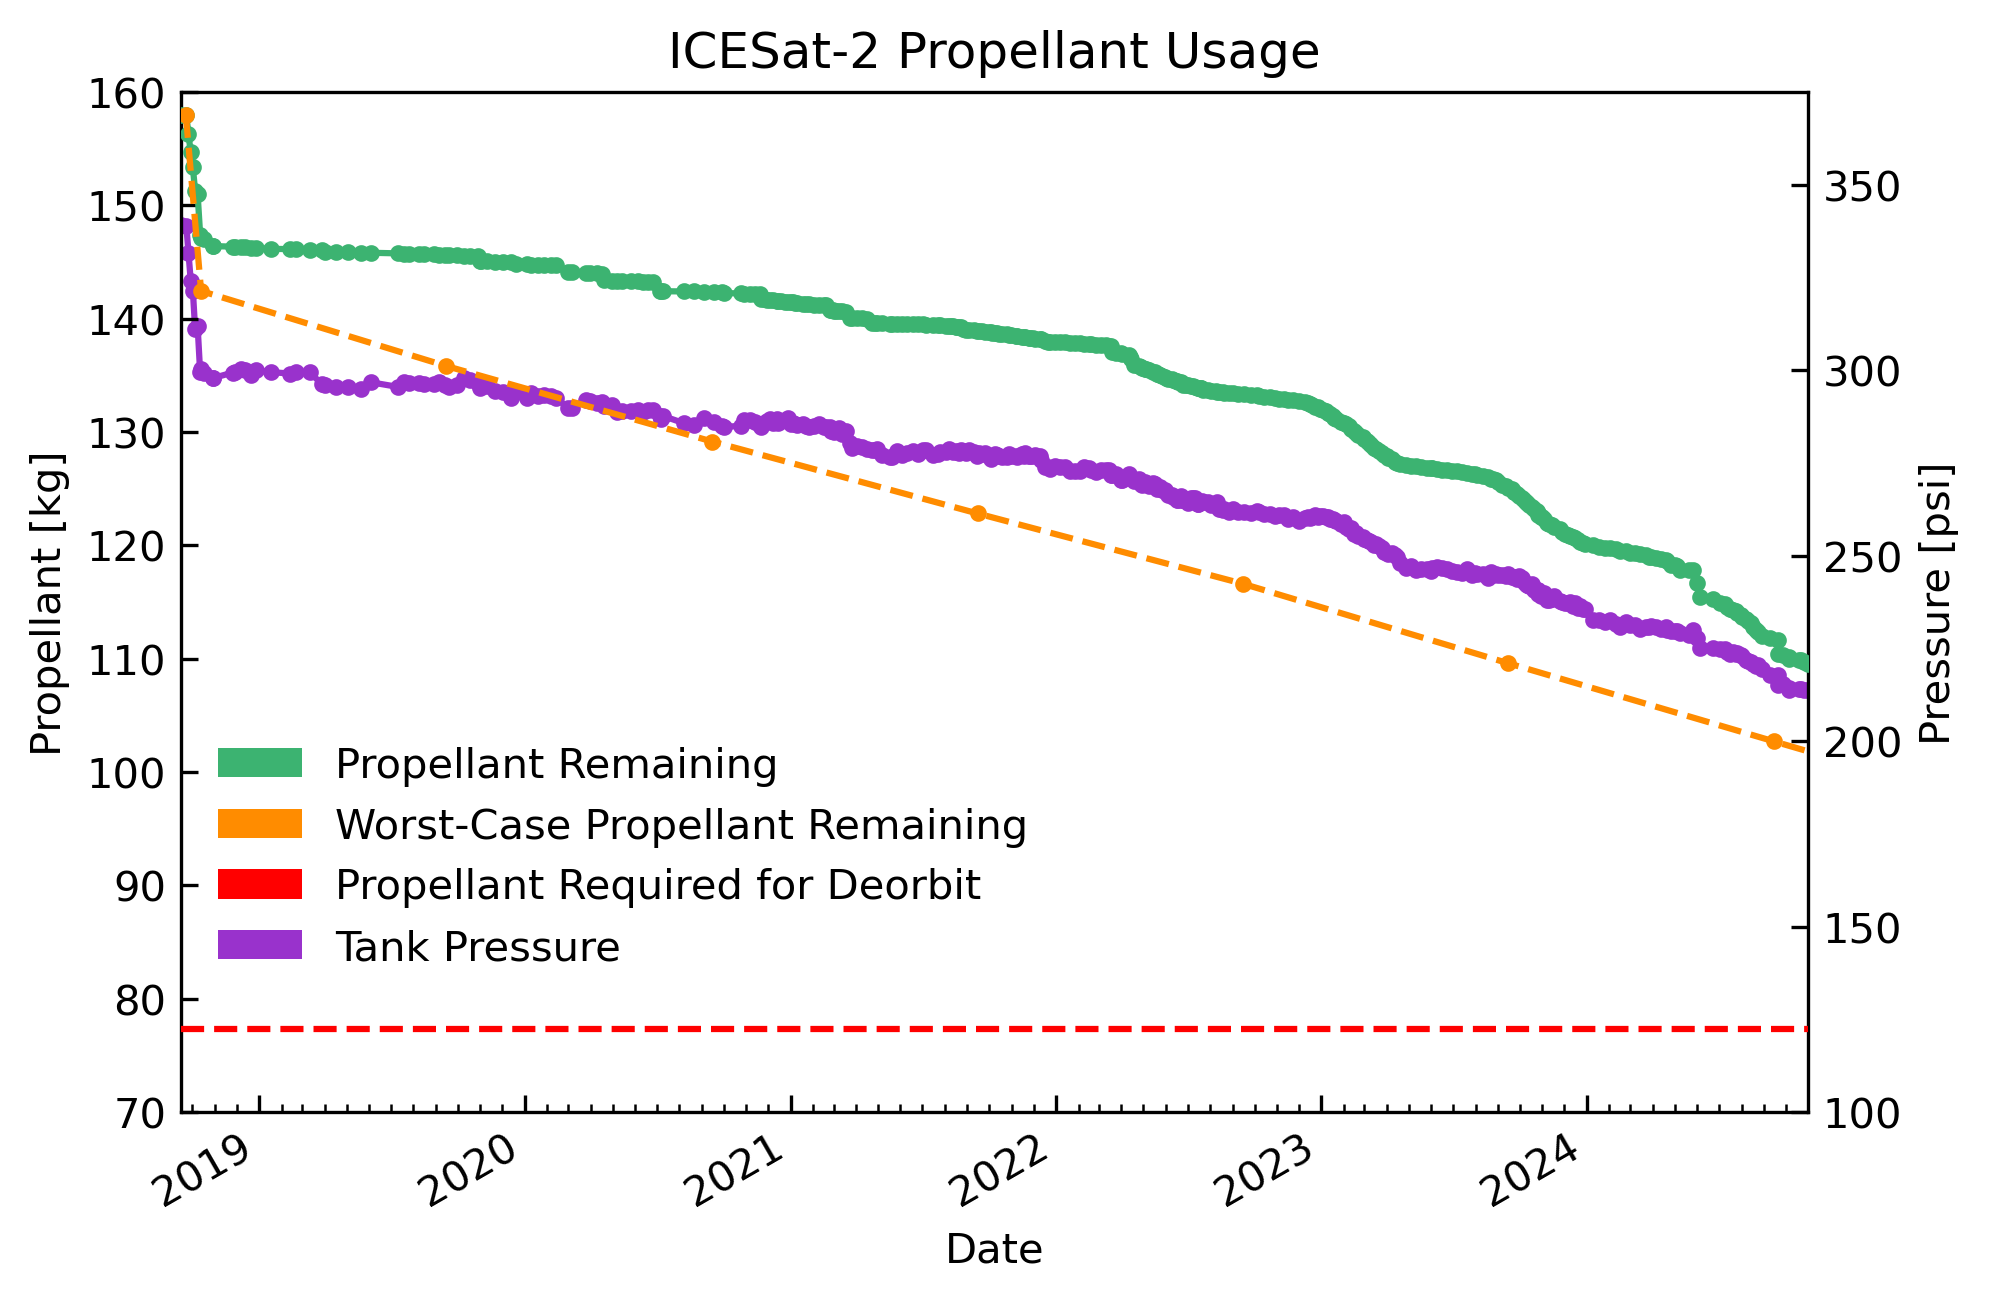
Future Mission Outlook
- Current Status: Nominal
- Performance metrics remain nominal and within mission requirements
- Over 2000 days in orbit
- Over 2 trillion laser pulses fired
- Life-limiting factor is on-board fuel → dependent on solar activity
Mission Product Development
- Release-07 of along-track products to be released in mid-2025
- Along-Track Coastal and Nearshore Bathymetry (ATL24) released in 2025
- Gridded Land and Vegetation Height product (ATL18) in development
- Gridded Sea Ice Freeboard Quicklook product (ATL20-QL) in development
- Possible future standard products are under development
- Neuenschwander, A. L., & Magruder, L. A. (2019). Canopy and Terrain Height Retrievals with ICESat-2: A First Look. Remote Sensing, 11(14), 1721. 10.3390/rs11141721
- Smith, B., Fricker, H. A., Holschuh, N., Gardner, A. S., Adusumilli, S., Brunt, K. M., Csatho, B., Harbeck, K., Huth, A., Neumann, T., Nilsson, J., & Siegfried, M. R. (2019). Land ice height-retrieval algorithm for NASA’s ICESat-2 photon-counting laser altimeter. Remote Sensing of Environment, 233, 111352. 10.1016/j.rse.2019.111352
- Palm, S. P., Yang, Y., Herzfeld, U., Hancock, D., Hayes, A., Selmer, P., Hart, W., & Hlavka, D. (2021). ICESat‐2 Atmospheric Channel Description, Data Processing and First Results. Earth and Space Science, 8(8). 10.1029/2020ea001470
- Felikson, D., Catania, G., Bartholomaus, T., Morlighem, M., & Noël, B. (2020). Inland limits to diffusion of thinning along Greenland Ice Sheet outlet glaciers. Zenodo. 10.5281/ZENODO.4284759
- Kwok, R., Markus, T., Kurtz, N. T., Petty, A. A., Neumann, T. A., Farrell, S. L., Cunningham, G. F., Hancock, D. W., Ivanoff, A., & Wimert, J. T. (2019). Surface Height and Sea Ice Freeboard of the Arctic Ocean From ICESat‐2: Characteristics and Early Results. Journal of Geophysical Research: Oceans, 124(10), 6942–6959. 10.1029/2019jc015486
- Petty, A. A., Kurtz, N. T., Kwok, R., Markus, T., & Neumann, T. A. (2020). Winter Arctic Sea Ice Thickness From ICESat‐2 Freeboards. Journal of Geophysical Research: Oceans, 125(5). 10.1029/2019jc015764
- Bagnardi, M., Kurtz, N. T., Petty, A. A., & Kwok, R. (2021). Sea Surface Height Anomalies of the Arctic Ocean From ICESat‐2: A First Examination and Comparisons With CryoSat‐2. Geophysical Research Letters, 48(14). 10.1029/2021gl093155
- Buzzanga, B., Heijkoop, E., Hamlington, B. D., Nerem, R. S., & Gardner, A. (2021). An Assessment of Regional ICESat‐2 Sea‐Level Trends. Geophysical Research Letters, 48(9). 10.1029/2020gl092327
- Morison, J., Dickinson, S., Hancock, D., Robbins, J., & Roberts, L. (2022). ICESat-2 ATL12 Ocean Surface Height and ATL19 Gridded Dynamic Ocean Topography. OCEANS 2022, Hampton Roads, 1–6. 10.1109/oceans47191.2022.9977076