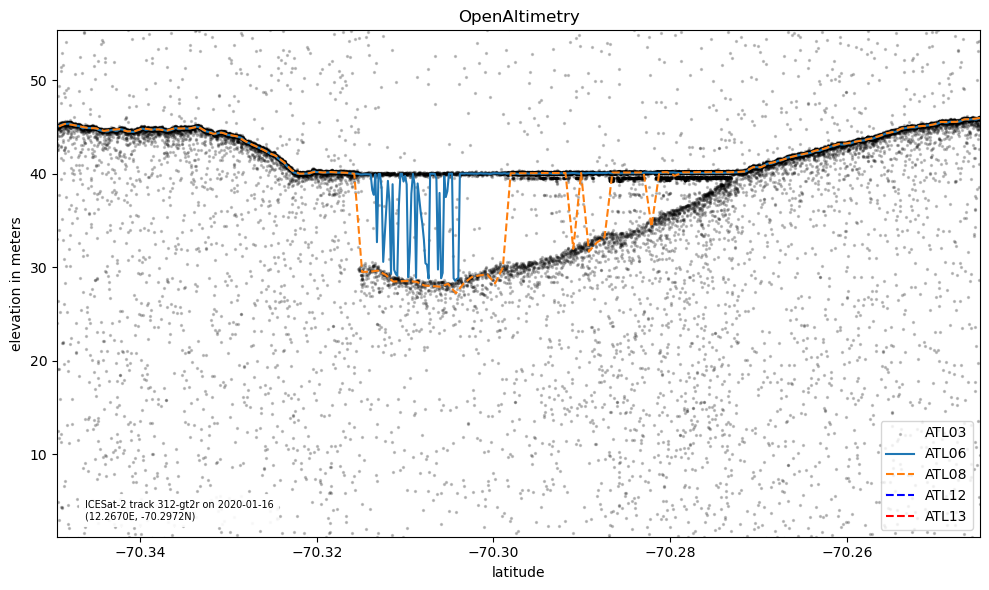
Comparison ATL03, ATL08, ATL12, and ATL13
Data downloaded with Open Altimetry
Computing environment
We’ll be using the following Python libraries in this notebook:
%matplotlib widget
# import os
# import ee
# import geemap
# import requests
# import numpy as np
# import pandas as pd
# import matplotlib.pylab as plt
# from datetime import datetime
# from datetime import timedelta
# import rasterio as rio
# from rasterio import plot
# from rasterio import warp
---------------------------------------------------------------------------
ModuleNotFoundError                       Traceback (most recent call last)
Input In [1], in <cell line: 1>()
----> 1 get_ipython().run_line_magic('matplotlib', 'widget')

File /opt/hostedtoolcache/Python/3.9.12/x64/lib/python3.9/site-packages/IPython/core/interactiveshell.py:2294, in InteractiveShell.run_line_magic(self, magic_name, line, _stack_depth)
   2292     kwargs['local_ns'] = self.get_local_scope(stack_depth)
   2293 with self.builtin_trap:
-> 2294     result = fn(*args, **kwargs)
   2295 return result

File /opt/hostedtoolcache/Python/3.9.12/x64/lib/python3.9/site-packages/IPython/core/magics/pylab.py:99, in PylabMagics.matplotlib(self, line)
     97     print("Available matplotlib backends: %s" % backends_list)
     98 else:
---> 99     gui, backend = self.shell.enable_matplotlib(args.gui.lower() if isinstance(args.gui, str) else args.gui)
    100     self._show_matplotlib_backend(args.gui, backend)

File /opt/hostedtoolcache/Python/3.9.12/x64/lib/python3.9/site-packages/IPython/core/interactiveshell.py:3444, in InteractiveShell.enable_matplotlib(self, gui)
   3423 def enable_matplotlib(self, gui=None):
   3424     """Enable interactive matplotlib and inline figure support.
   3425
   3426     This takes the following steps:
   (...)
   3442         display figures inline.
   3443     """
-> 3444     from matplotlib_inline.backend_inline import configure_inline_support
   3446     from IPython.core import pylabtools as pt
   3447     gui, backend = pt.find_gui_and_backend(gui, self.pylab_gui_select)

File /opt/hostedtoolcache/Python/3.9.12/x64/lib/python3.9/site-packages/matplotlib_inline/backend_inline.py:6, in <module>
      1 """A matplotlib backend for publishing figures via display_data"""
      3 # Copyright (c) IPython Development Team.
      4 # Distributed under the terms of the BSD 3-Clause License.
----> 6 import matplotlib
      7 from matplotlib.backends.backend_agg import (  # noqa
      8     new_figure_manager,
      9     FigureCanvasAgg,
     10     new_figure_manager_given_figure,
     11 )
     12 from matplotlib import colors

ModuleNotFoundError: No module named 'matplotlib'
import sys
sys.path.append('../')
The import below is the dataCollector class that the organizers wrote. It helps us read and store data from the OpenAltimetry API.
from coastal.oa import dataCollector
Get data URL from the OpenAltimetry API
Go to openaltimetry.org
Select BROWSE ICESAT-2 DATA.
Select ATL 08 on the left
Select a date
Click SELECT A REGION on the top left, and drew a rectangle
Right click on the rectangle and select View Elevation profile. This opens a pop up, and shows ATL06 and ATL08 elevations.
Scroll to the bottom and select Get API URL. Copy it.
We can now initialize a dataCollector object, using the copy-pasted OpenAltimetry API URL, and the beam we would like to look at.
Note, we don’t need EarthData credentials for this.
url = 'http://openaltimetry.org/data/api/icesat2/atl13?date=2020-12-15&minx=-77.858681&miny=25.728091&maxx=-77.831461&maxy=25.832559&trackId=1254&beamName=gt1r&beamName=gt1l&outputFormat=json'
gtx = 'gt1r'
is2data = dataCollector(oaurl=url, beam=gtx, verbose=True)
OpenAltimetry API URL: http://openaltimetry.org/data/api/icesat2/atlXX?date=2020-12-15&minx=-77.858681&miny=25.728091&maxx=-77.831461&maxy=25.832559&trackId=1254&outputFormat=json&beamName=gt1r&client=jupyter
Date: 2020-12-15
Track: 1254
Beam: gt1r
Latitude limits: [25.728091, 25.832559]
Longitude limits: [-77.858681, -77.831461]
Another way to get the OA URL
Alternatively, we could use a date, track number, beam, and lat/lon bounding box as input to the dataCollector.
latlims = [-70.34957, -70.24491]
lonlims = [12.10769, 12.42636]
rgt = 312 # track number
gtx = 'gt2r' # The beam
date = '2020-01-16'
is2data = dataCollector(date=date, latlims=latlims, lonlims=lonlims, track=rgt, beam=gtx, verbose=True)
OpenAltimetry API URL: https://openaltimetry.org/data/api/icesat2/atlXX?date=2020-01-16&minx=12.10769&miny=-70.34957&maxx=12.42636&maxy=-70.24491&trackId=312&beamName=gt2r&outputFormat=json&client=jupyter
Date: 2020-01-16
Track: 312
Beam: gt2r
Latitude limits: [-70.34957, -70.24491]
Longitude limits: [12.10769, 12.42636]
Note that this also constructs the API url for us.
Requesting the data from the OpenAltimetry API
Here we use the requestData() function of the dataCollector class, which is defined in utils/oa.py. It downloads ATL03, ATL06 and ATL08 data based on the inputs with which we initialized our dataCollector, and writes them to pandas dataframes.
is2data.requestData(verbose=True)
---> requesting ATL03 data... Done.
---> requesting ATL06 data... Done.
---> requesting ATL08 data... Done.
---> requesting ATL12 data... Done.
---> requesting ATL13 data... Done.
The data are now stored as pandas data frames in our dataCollector object. To verify this, we can run the cell below.
Plotting the data
To make plots easier to produce, the dataCollector class in utils/oa.py has a method to plot the data that we downloaded.
%%capture
fig = is2data.plotData()
fig
We can make a function to put all this together.
See the function plot_from_oa_url in ./coastal/plot.py.
Examples
%%capture
url = 'http://openaltimetry.org/data/api/icesat2/atl13?date=2020-12-15&minx=-77.858681&miny=25.728091&maxx=-77.831461&maxy=25.832559&trackId=1254&beamName=gt1r&beamName=gt1l&outputFormat=json'
gtx = 'gt1r'
myplot, mydata = plot_from_oa_url(url=url, gtx=gtx, title='Coastal Example')
myplot.savefig('geemap_tutorial_exercise1.jpg', dpi=300)
---------------------------------------------------------------------------
NameError                                 Traceback (most recent call last)
Input In [9], in <cell line: 3>()
      1 url = 'http://openaltimetry.org/data/api/icesat2/atl13?date=2020-12-15&minx=-77.858681&miny=25.728091&maxx=-77.831461&maxy=25.832559&trackId=1254&beamName=gt1r&beamName=gt1l&outputFormat=json'
      2 gtx = 'gt1r'
----> 3 myplot, mydata = plot_from_oa_url(url=url, gtx=gtx, title='Coastal Example')
      4 myplot.savefig('geemap_tutorial_exercise1.jpg', dpi=300)

NameError: name 'plot_from_oa_url' is not defined
myplot
---------------------------------------------------------------------------
NameError                                 Traceback (most recent call last)
Input In [10], in <cell line: 1>()
----> 1 myplot

NameError: name 'myplot' is not defined
data = is2data.requestData()
%%capture
#use capture to prevent the plot
url = 'http://openaltimetry.org/data/api/icesat2/atl12?date=2021-12-15&minx=-154.32381980236076&miny=56.873762230836434&maxx=-154.29895036037468&maxy=56.93202651616244&trackId=1280&beamName=gt1r&beamName=gt1l&outputFormat=json'
gtx = 'gt1r'
myplot, mydata = plot_from_oa_url(url=url, gtx=gtx, title='Alaska Coast')
myplot.savefig('geemap_tutorial_exercise1.jpg', dpi=300)
myplot
%%capture
url = 'http://openaltimetry.org/data/api/icesat2/atl03?date=2020-01-16&minx=12.107692195781404&miny=-70.34956862465471&maxx=12.426364789894341&maxy=-70.2449105354736&trackId=312&beamName=gt3r&beamName=gt3l&beamName=gt2r&beamName=gt2l&beamName=gt1r&beamName=gt1l&outputFormat=json'
gtx = 'gt2r'
myplot, mydata = plot_from_oa_url(url=url, gtx=gtx, title='Lake Example')
myplot.savefig('geemap_tutorial_exercise1.jpg', dpi=300)
myplot